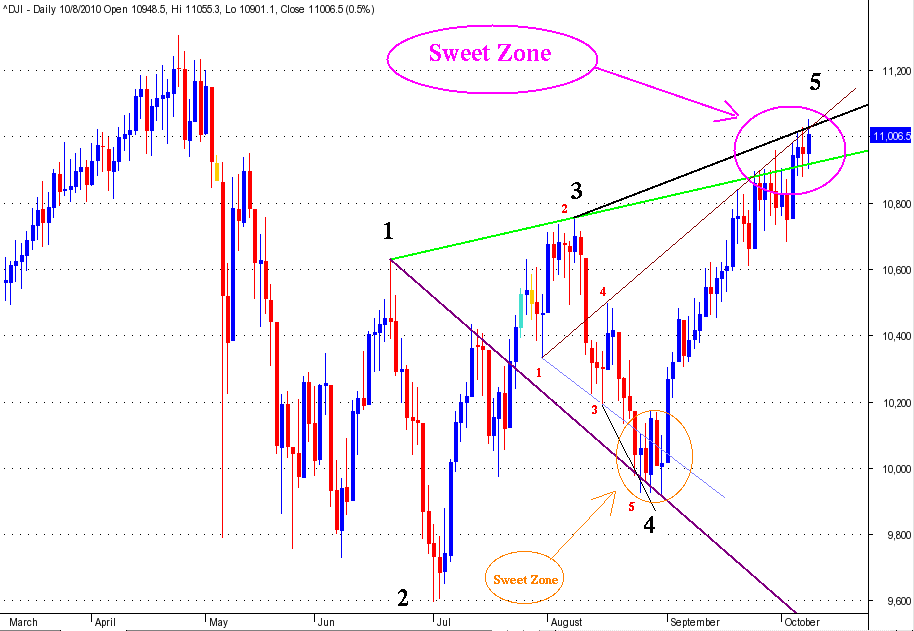
Structured Wolfe Wave setting up in DJIA
The Estimated Price at Arrival line implies a significant correction is coming over the next few weeks. If it lasts as long as the previous correction, it likely will drop to the 9000 level or lower.
As I said before, my wolfees are some what mutants LOL
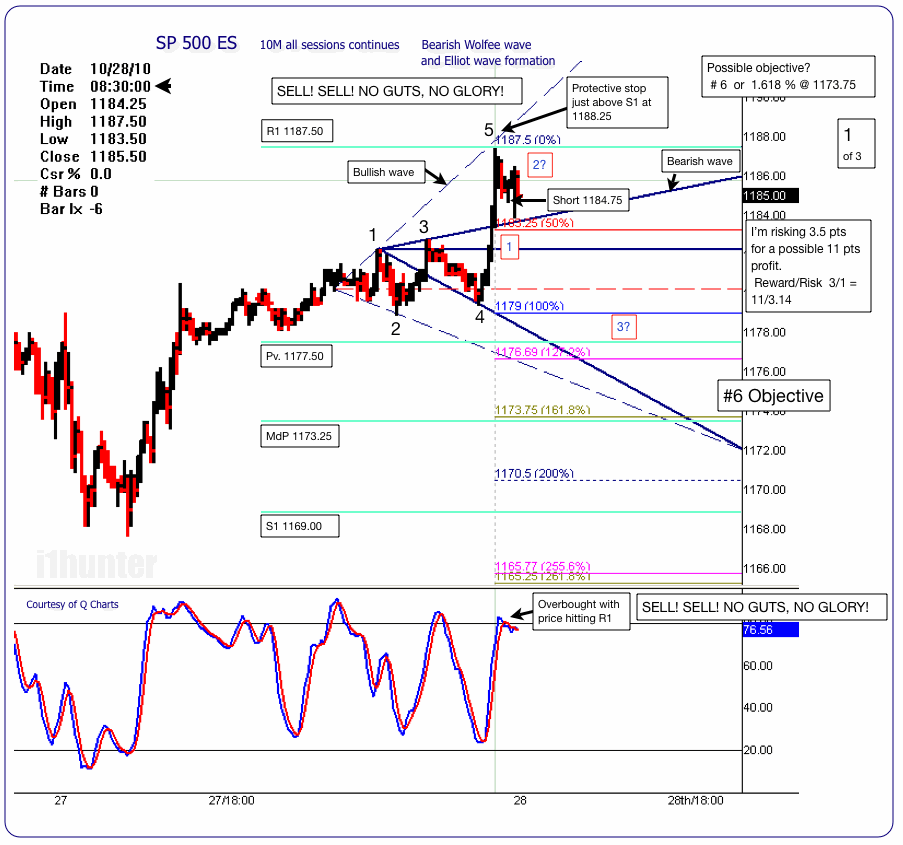
Here is a 10m chart from this morning's play. It started by the price hitting R1 BMO at 08:30 with the stochastic in overbought territory as the price hits R1, little after that, the price made what appears to be a 1 and 2 of a bearish Elliot W. plus I had a bullish mutant wolfee finishing the #6 point. That #6 was a #5 for my mutant bearish wolfee as seeing in the chart. Since I never know what the market is going to do, all I can do is take the trade "as I see it", use R/R to place my stop and let the market show me the rest. May be it works, may be it does not, but I will never know unless I try..............I hate the " I could, I should, I would"............
The chart below is self explanatory..............2 more charts will follow
Impressive !
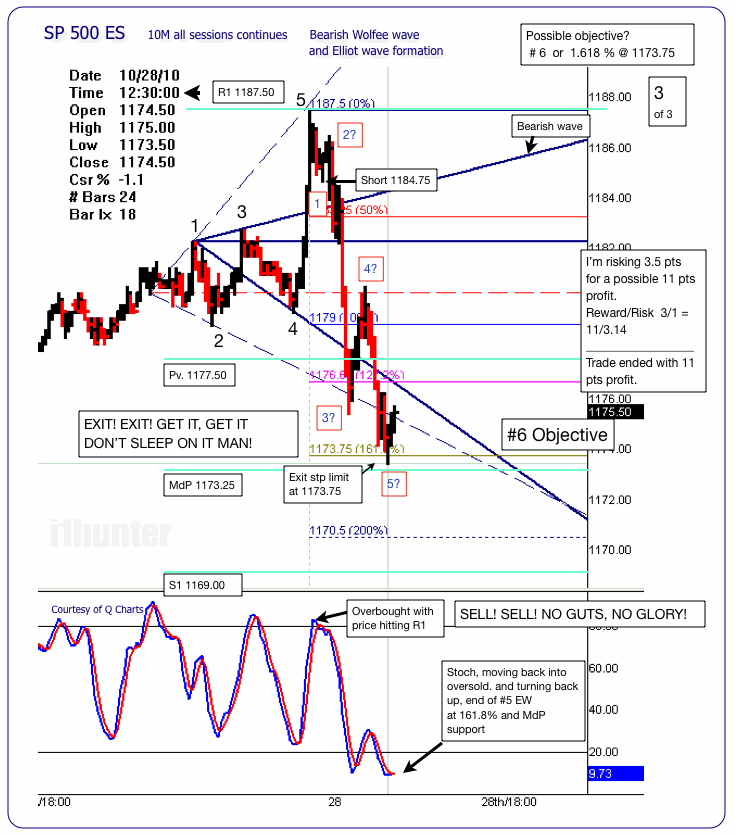
Again that is not an 'official' WW because the 1-3 and 2-4 lines do not converge; however, it doesn't really matter if you can trade it effectively.
Notice how the 1-3 line his the 4-5 swing near its mid point and if you draw the 2-4 line, it hits the 5-6 swing near its midpoint.
This is not an uncommon occurrence. Trendlines tend to hit price swings at their endpoint or midpoint.
Notice how the 1-3 line his the 4-5 swing near its mid point and if you draw the 2-4 line, it hits the 5-6 swing near its midpoint.
This is not an uncommon occurrence. Trendlines tend to hit price swings at their endpoint or midpoint.
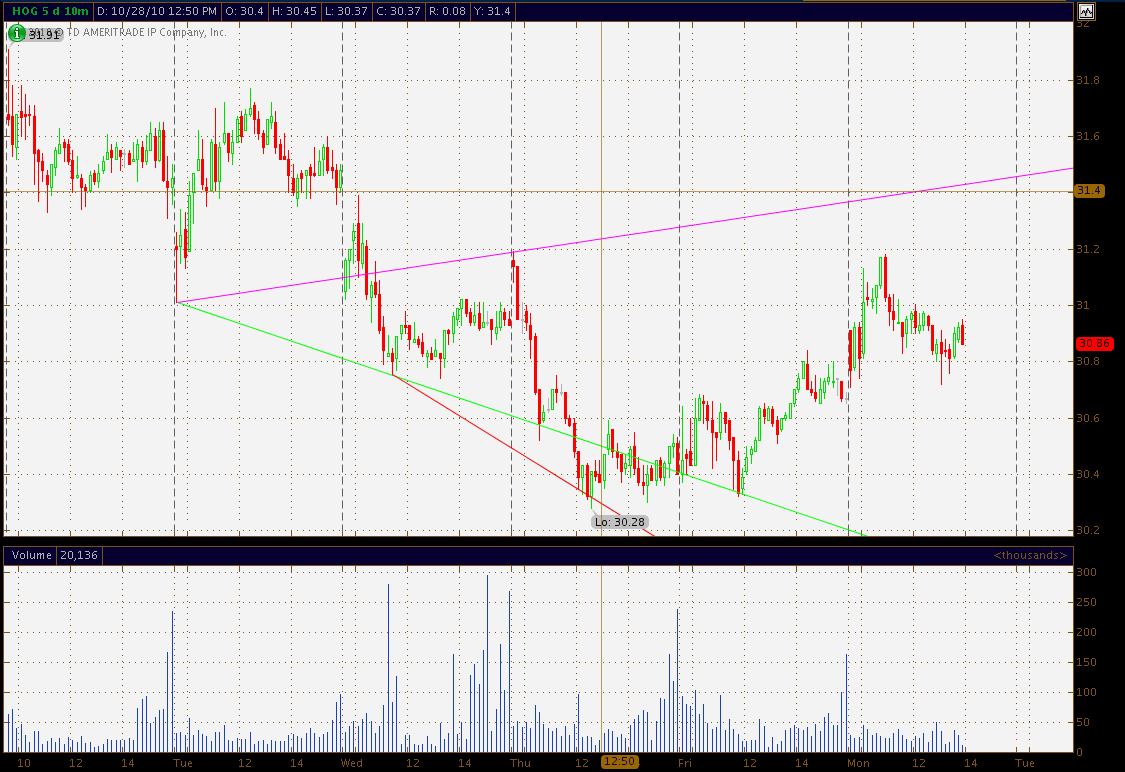
Here is a WW on a 10 minute chart in HOG (Harley-Davidson).
It has not reached the target line (yet) but Bill Wolfe warns that the 4 Point is Support/Resistance and can reverse a price swing. Probably a good place to at least take partial profits.
Bill. Nice WW. Thanks for the chart and comments.
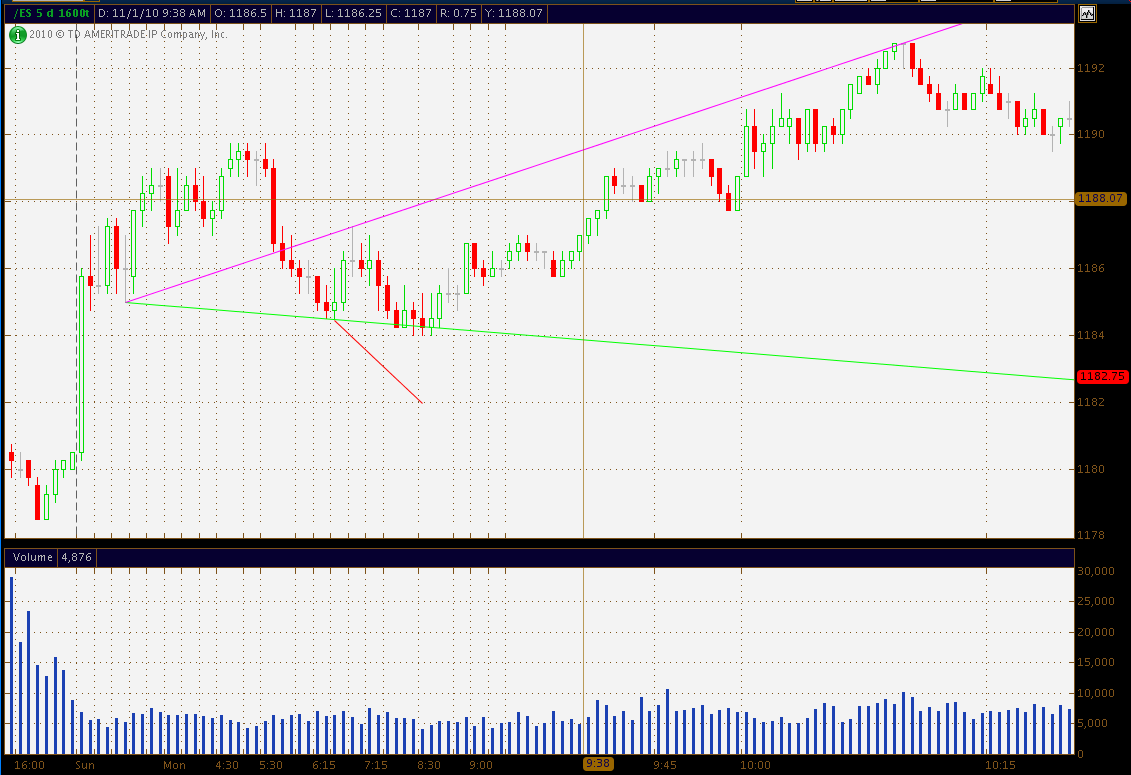
I was looking at today's ES action. Do you see the WW in the 1 minute chart?
I was looking at today's ES action. Do you see the WW in the 1 minute chart?
Originally posted by BHReach
Here is a WW on a 10 minute chart in HOG (Harley-Davidson).
It has not reached the target line (yet) but Bill Wolfe warns that the 4 Point is Support/Resistance and can reverse a price swing. Probably a good place to at least take partial profits.
I was looking at today's ES action. Do you see the WW in the 1 minute chart?
I found one sizable WW but it is easier to see and more symmetrical on a 1600 tick chart than a 1 minute chart.
There were a few very small ones not worth trading.
I have the WW but starts from the overnight. # 1, 08:30 @ 1191.25 H, # 4, 09:44 @ 1188.25. I think it is making a # 2 of a bearish EW If so then I will be looking at 1176 as the objective. Will see, it needs to finish #2 EW wave first. Will see, In due time will show us the way.
Bearish EW will be voided if price moves above today's high......
Bearish EW will be voided if price moves above today's high......
If this is a #2 Bearish EW, it should start right about here. ES now trading at 1191.00 @ 13:22> If it is not then it should have void the EW. by 14:11
14:11 is a small time cycle, with 14:55 15:18, 15:48 and 16:03. I look for small highs and lows at support resistance on this times. Will see.
14:11 is a small time cycle, with 14:55 15:18, 15:48 and 16:03. I look for small highs and lows at support resistance on this times. Will see.
Originally posted by i1hunter
I have the WW but starts from the overnight. # 1, 08:30 @ 1191.25 H, # 4, 09:44 @ 1188.25. I think it is making a # 2 of a bearish EW If so then I will be looking at 1176 as the objective. Will see, it needs to finish #2 EW wave first. Will see, In due time will show us the way.
Bearish EW will be voided if price moves above today's high......
Emini Day Trading /
Daily Notes /
Forecast /
Economic Events /
Search /
Terms and Conditions /
Disclaimer /
Books /
Online Books /
Site Map /
Contact /
Privacy Policy /
Links /
About /
Day Trading Forum /
Investment Calculators /
Pivot Point Calculator /
Market Profile Generator /
Fibonacci Calculator /
Mailing List /
Advertise Here /
Articles /
Financial Terms /
Brokers /
Software /
Holidays /
Stock Split Calendar /
Mortgage Calculator /
Donate
Copyright © 2004-2023, MyPivots. All rights reserved.
Copyright © 2004-2023, MyPivots. All rights reserved.
