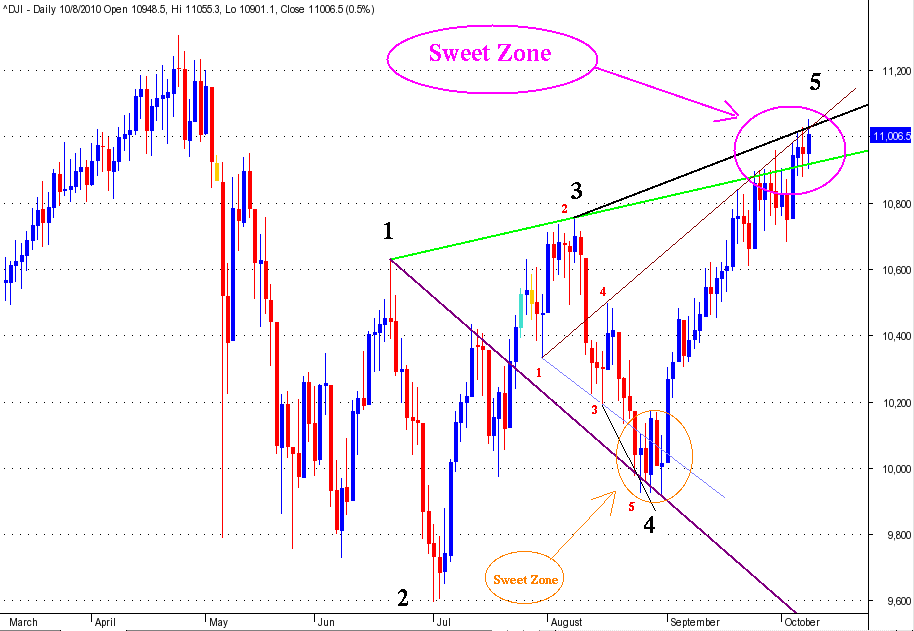
Structured Wolfe Wave setting up in DJIA
The Estimated Price at Arrival line implies a significant correction is coming over the next few weeks. If it lasts as long as the previous correction, it likely will drop to the 9000 level or lower.
Here's some Wolfe Wave info links that might help out here:
http://www.wolfewave.com/
http://www.chart.nu/wolfewave.htm
http://www.investopedia.com/articles/trading/05/040405.asp
http://www.forexmt4.com/_MT4_Tutorials/Wolfe%20Waves.pdf
http://dummyspots.com/2007/05/three-little-indians-and-a-wolfe/
Hope this is helpful.
MM
http://www.wolfewave.com/
http://www.chart.nu/wolfewave.htm
http://www.investopedia.com/articles/trading/05/040405.asp
http://www.forexmt4.com/_MT4_Tutorials/Wolfe%20Waves.pdf
http://dummyspots.com/2007/05/three-little-indians-and-a-wolfe/
Hope this is helpful.
MM
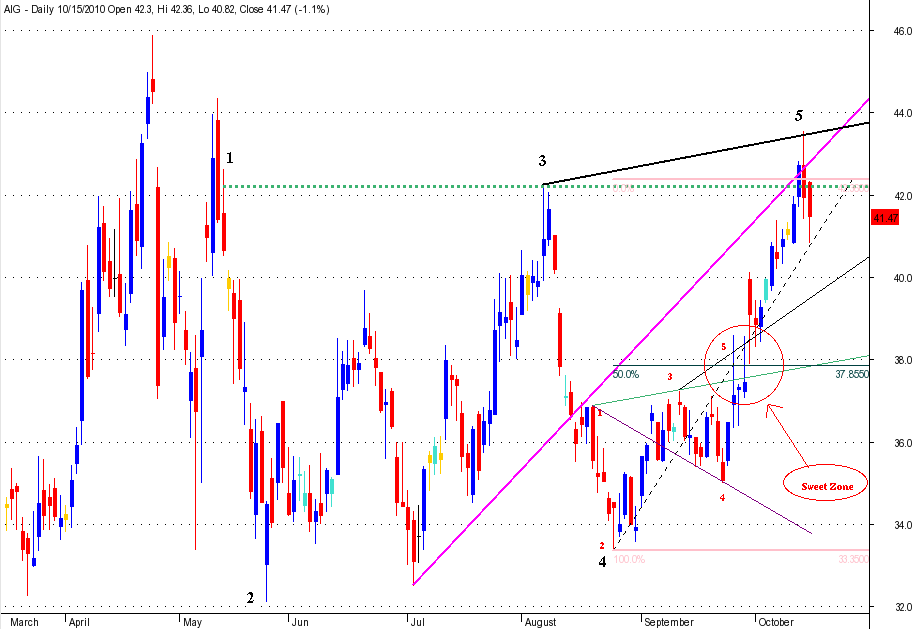
Notice the small WW failure caused by it being overpowered by a larger WW. After price entered the Sweet Zone for the smaller WW, it only retraced 59% of the way to the Target Line before reversing.
This is an instructive example because I have noticed that when a WW fails, the 5th swing frequently goes to about double it's projected end point. It appears to be doing that in this case. That also happens to be the SZ for the larger WW.
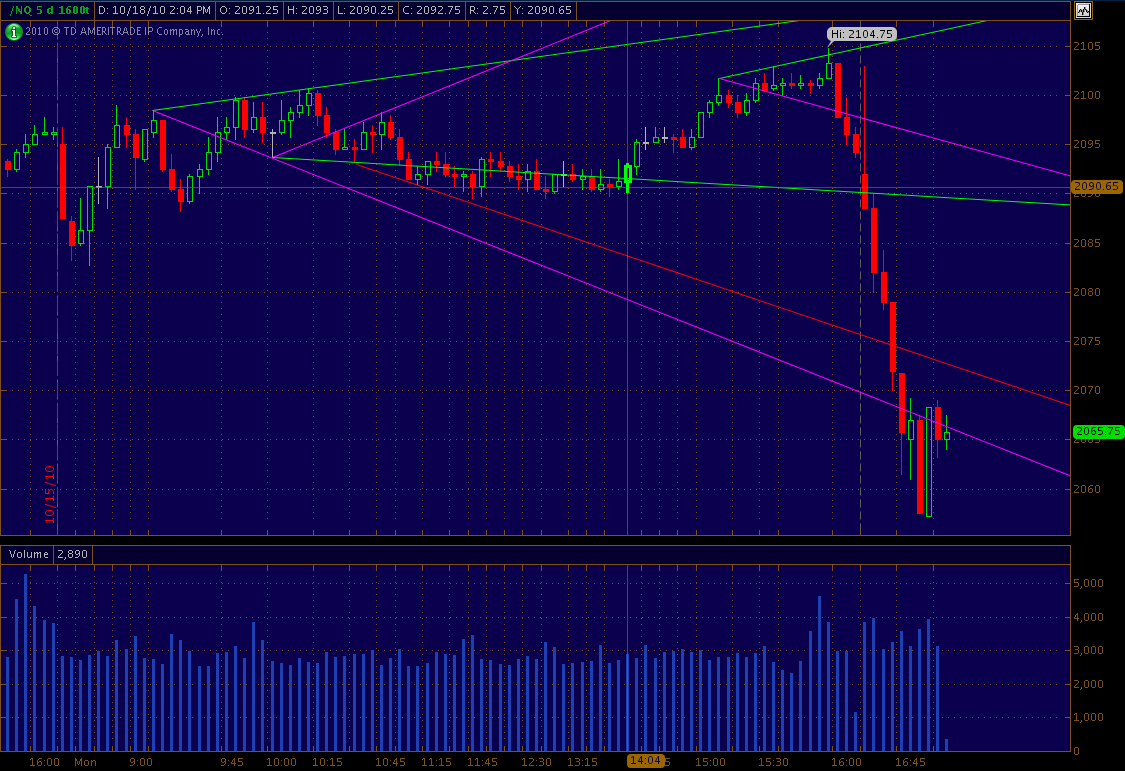
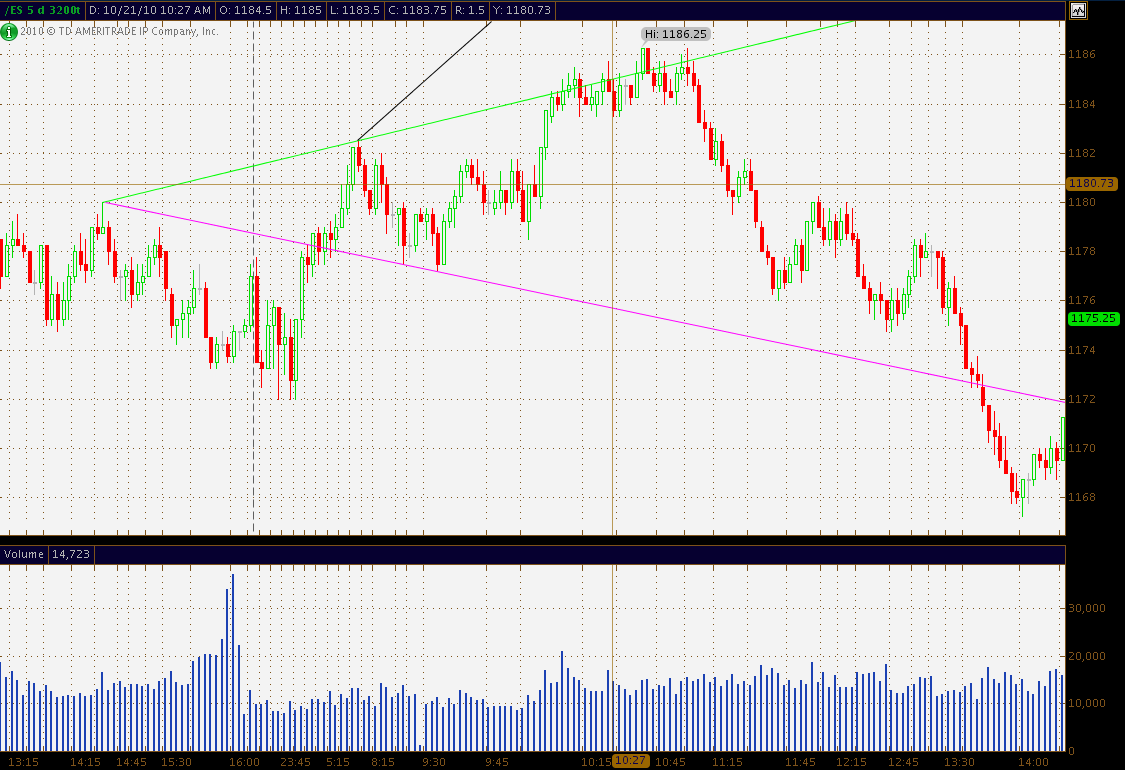
There are 3 WWs on this 1600 tick chart for today. 1st 2 did not reach the target line because a contrary WW formed. The last WW not only reached the target line but blew through it after RTH.
Notice how the 2nd WW stayed in the SZ for a long time. That is not uncommon. It takes patience to trade that. It can last for weeks on a Daily chart.
Notice how the 2nd WW stayed in the SZ for a long time. That is not uncommon. It takes patience to trade that. It can last for weeks on a Daily chart.
Real Thanks to Bill and MM
Bill, your observation about going twice the target, I have seen it before but had no idea what a "tell" for a move like that would be. Thanks,
jeez, looks like I have to spend some time refreshing myself with the mechanics of identifying the WWs.
Bill, your observation about going twice the target, I have seen it before but had no idea what a "tell" for a move like that would be. Thanks,
jeez, looks like I have to spend some time refreshing myself with the mechanics of identifying the WWs.
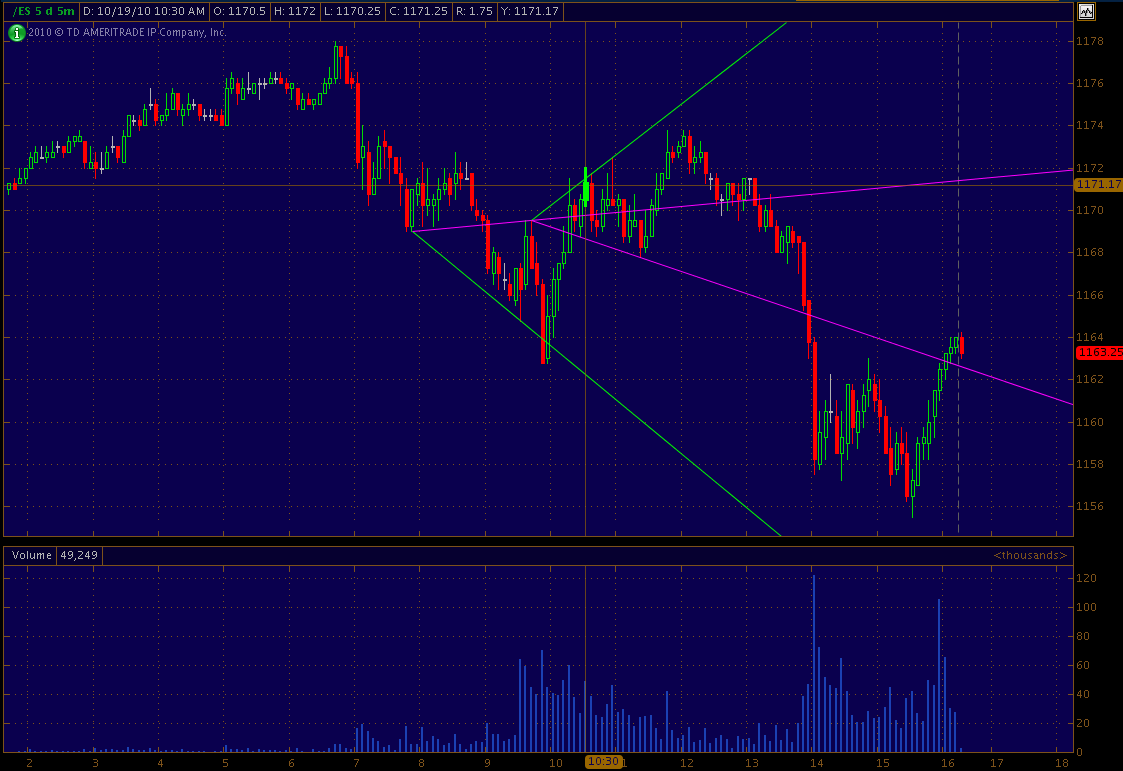
5 min ES chart has 2 WWs both profitable. The 1st yielded an 8 point swing of which you should have gotten about 6 points. The 2nd one yielded a 9 point swing (it actually was much larger because it blew through the target line). Unfortunately, you would probably have missed the move because it missed hitting the 1-3 line by 2 ticks.
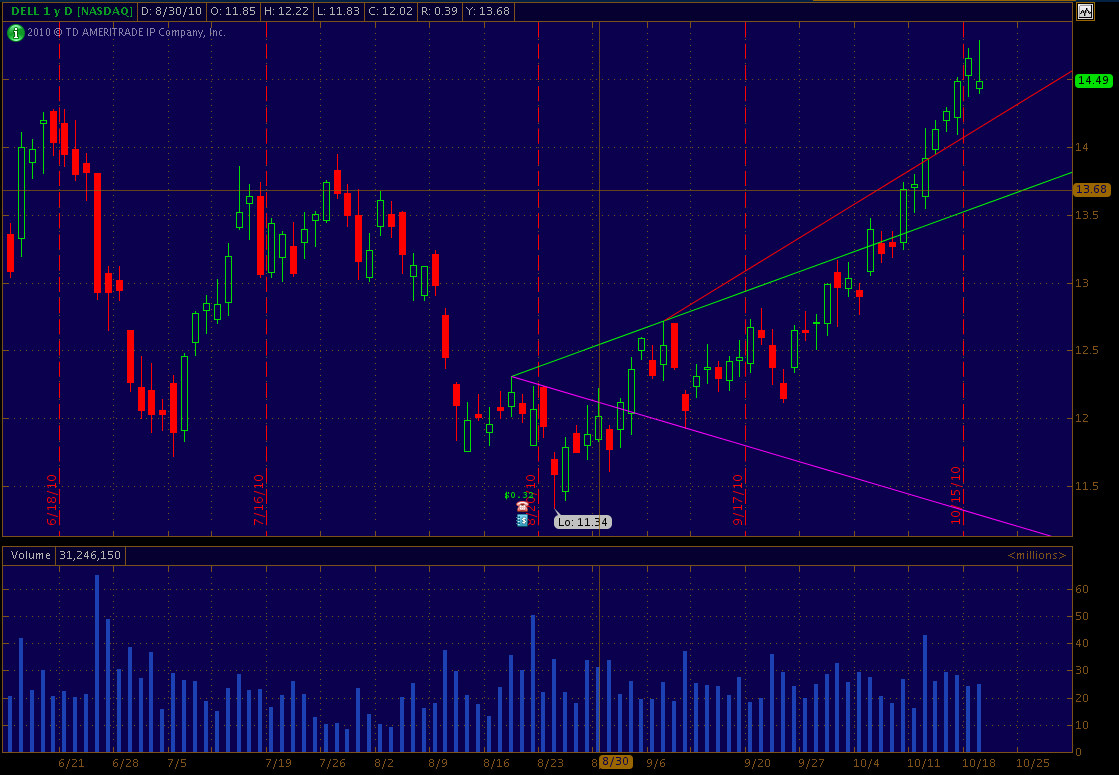
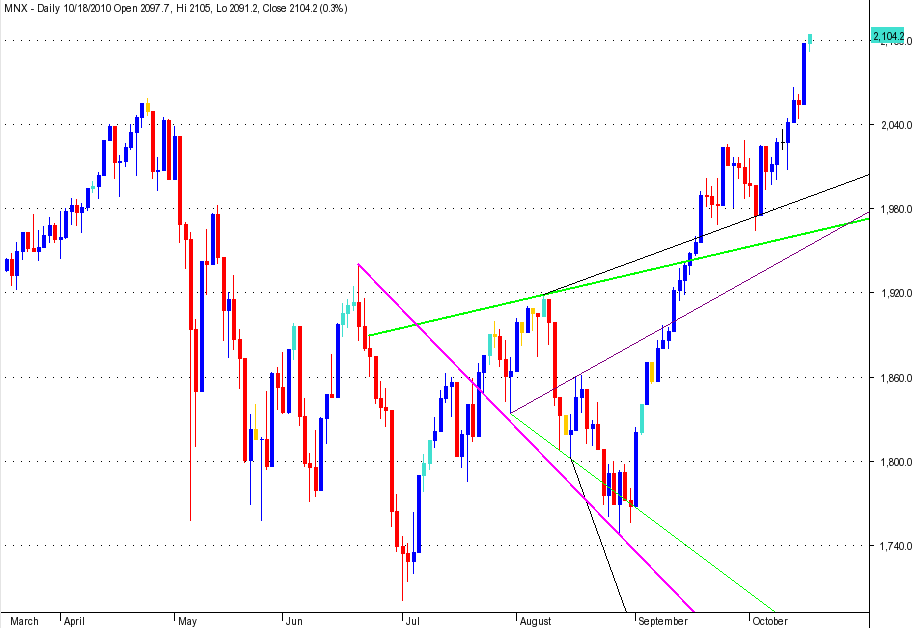
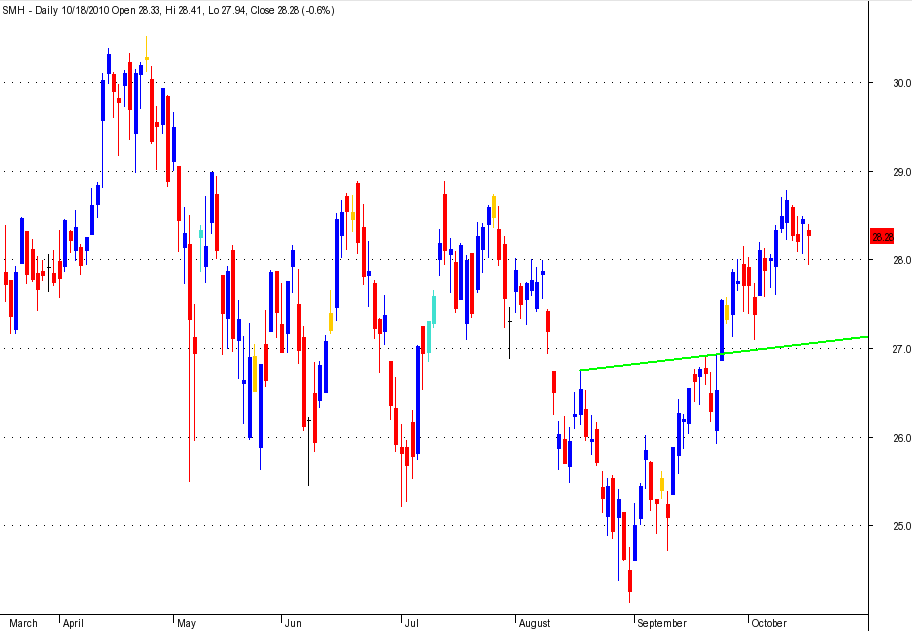
The other 3 charts are WW failures. It is important to recognize that nothing works 100% of the time and there will be losses with any technique. Your trading plan needs to include a strategy for managing the losses.
DELL and MNX blew through the SZ and SMH blew through the 1-3 target line and its SZ was so large it was useless. So far, all three have gone about double the expected size of the 4-5 swing.
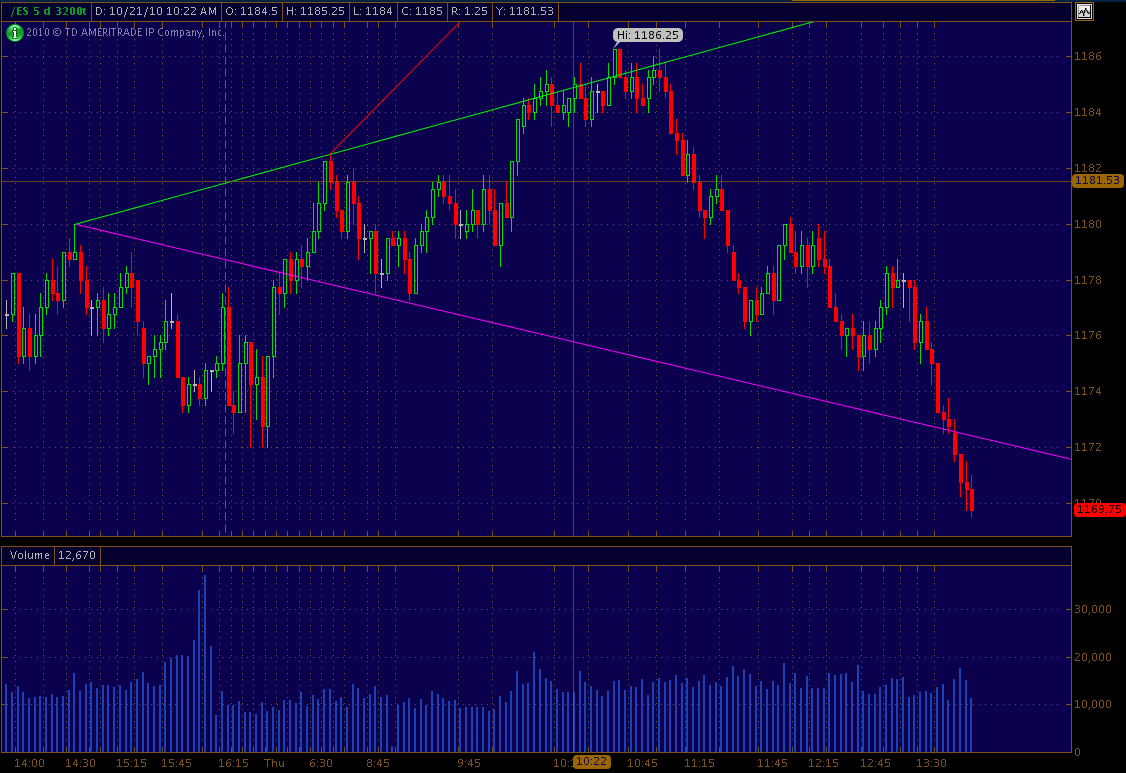
This is a WW on a little larger chart. It lasted for 3 1/2 hours but captured 12 points. Notice how price road the 1-3 line for an hour of nail biting before it topped out and dropped like a rock. That is not uncommon behavior.
Bill,
thanks for posting.
I have trouble seeing the black background charts.
can you post what bar type (like 5min or 1600 tic etc)
and can you number your waves?
Paul
thanks for posting.
I have trouble seeing the black background charts.
can you post what bar type (like 5min or 1600 tic etc)
and can you number your waves?
Paul
Different software has different defaults. BTW, there is a good reason some software defaults to a dark background, it puts less strain on your eyes.
It is time consuming to label the points and it really isn't necessary. I have been using a consistent color code for my lines. The 1-3 line is green, the 1-4 line is violet and the line marking the end of the SZ is black or red. That is enough help so you should be able to figure out the 5 points.
If you want to trade WWs, you need to be able to spot them in real time without any help.
Bill, this is great stuff ... keep it coming! I've got the Wolfe Wave manual from the late 90's and have visited with him about stuff via phone. Have a buddy who trades WW's in the ES almost exclusively. But he also incorporates Tick charts, which kinda departs from the price/TIME component of what the esteemed Mr. Wolfe has as his analysis of the waves ... on time-frames from 1-minute charts and up. Much appreciated mister!
thanks, Bill.
Just by telling me about the color of the lines is all I needed.
I used to use black background charts exclusively,
but after a period of drawdown I decided I had to be militaristic about analyzing my trades and I started keeping a diary. Part of my documentation in the diary is a chart showing what I knew at the time, I imbed the charts right into the word doc and when I print week's worth of diary on the weekend, I use white background charts because for my eye, easier to see and takes less ink to print.
I keep only one style of chart with black background, charts that I use to plot NDX divided by S&P500 to see relative strength in real time.
If this is a #2 Bearish EW, it should start right about here. ES now trading at 1191.00 @ 13:22> If it is not then it should have void the EW. by 14:11
14:11 is a small time cycle, with 14:55 15:18, 15:48 and 16:03. I look for small highs and lows at support resistance on this times. Will see.
14:11 is a small time cycle, with 14:55 15:18, 15:48 and 16:03. I look for small highs and lows at support resistance on this times. Will see.
Originally posted by i1hunter
I have the WW but starts from the overnight. # 1, 08:30 @ 1191.25 H, # 4, 09:44 @ 1188.25. I think it is making a # 2 of a bearish EW If so then I will be looking at 1176 as the objective. Will see, it needs to finish #2 EW wave first. Will see, In due time will show us the way.
Bearish EW will be voided if price moves above today's high......
Emini Day Trading /
Daily Notes /
Forecast /
Economic Events /
Search /
Terms and Conditions /
Disclaimer /
Books /
Online Books /
Site Map /
Contact /
Privacy Policy /
Links /
About /
Day Trading Forum /
Investment Calculators /
Pivot Point Calculator /
Market Profile Generator /
Fibonacci Calculator /
Mailing List /
Advertise Here /
Articles /
Financial Terms /
Brokers /
Software /
Holidays /
Stock Split Calendar /
Mortgage Calculator /
Donate
Copyright © 2004-2023, MyPivots. All rights reserved.
Copyright © 2004-2023, MyPivots. All rights reserved.
