ES Short Term Trading 9-17-2010
http://www.cmegroup.com/market-data/datamine-historical-data/datamine.html
This would be the easy way but you have to pay for it.
This would be the easy way but you have to pay for it.
Originally posted by Big Mike
Originally posted by Lorn
You asking for the yearly open and close or the dailies?
Originally posted by Big Mike
Does anyone have a source for RTH Open and Close for ES for 2008 and 2009.
Thanks in advance!
Dailies, sorry for omitting that.
Thanks Lorn. I have spoken with them, it is too expensive for the testing that I want to do. I will have to SPX data instead, I guess.
What data vendor do you use for trading? It would be tedious work but you could get all the data you wanted if your data provider has enough historical information available.
Originally posted by Big Mike
Thanks Lorn. I have spoken with them, it is too expensive for the testing that I want to do. I will have to SPX data instead, I guess.
Using Strategy Runner, pretty barebones-no backtesting add on available.
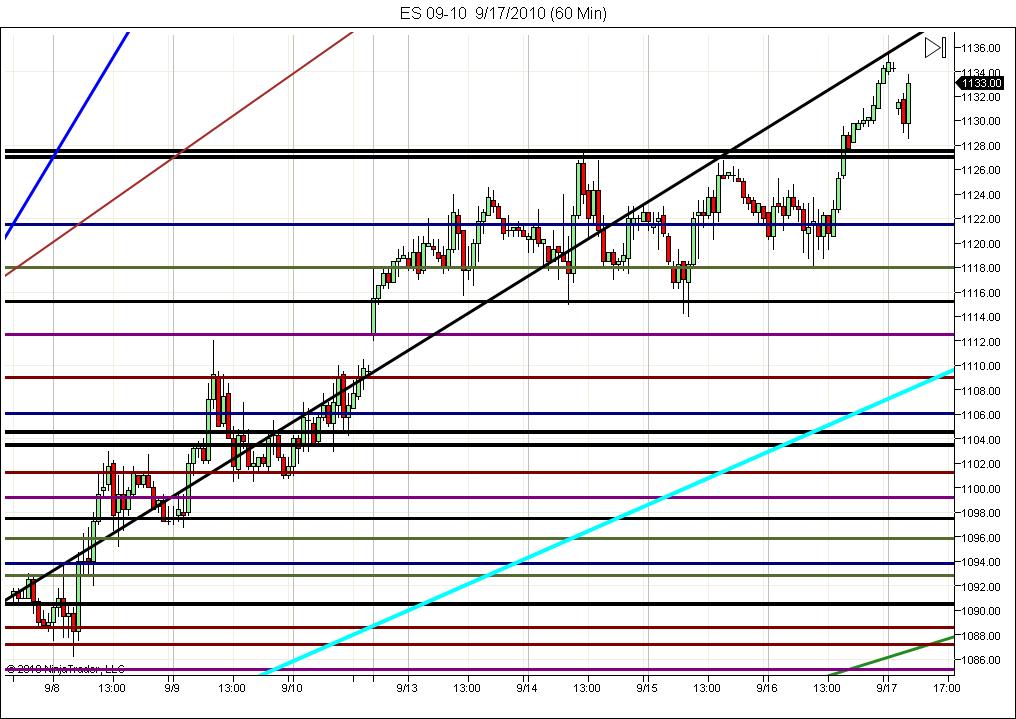
Here's my September contract chart. I had posted here awhile ago that a C wave would reach a minimum of 1137 based on EW rules(if indeed a C wave).
Either not a C wave or my calculations wrong.
Since the rollover, the contracts maintained a 5 point difference in value. I assumed that would equate to an 1132 target for the December contract or it would catch up to the previoous contract value.
Not a big deal. Just noting this.
Either not a C wave or my calculations wrong.
Since the rollover, the contracts maintained a 5 point difference in value. I assumed that would equate to an 1132 target for the December contract or it would catch up to the previoous contract value.
Not a big deal. Just noting this.
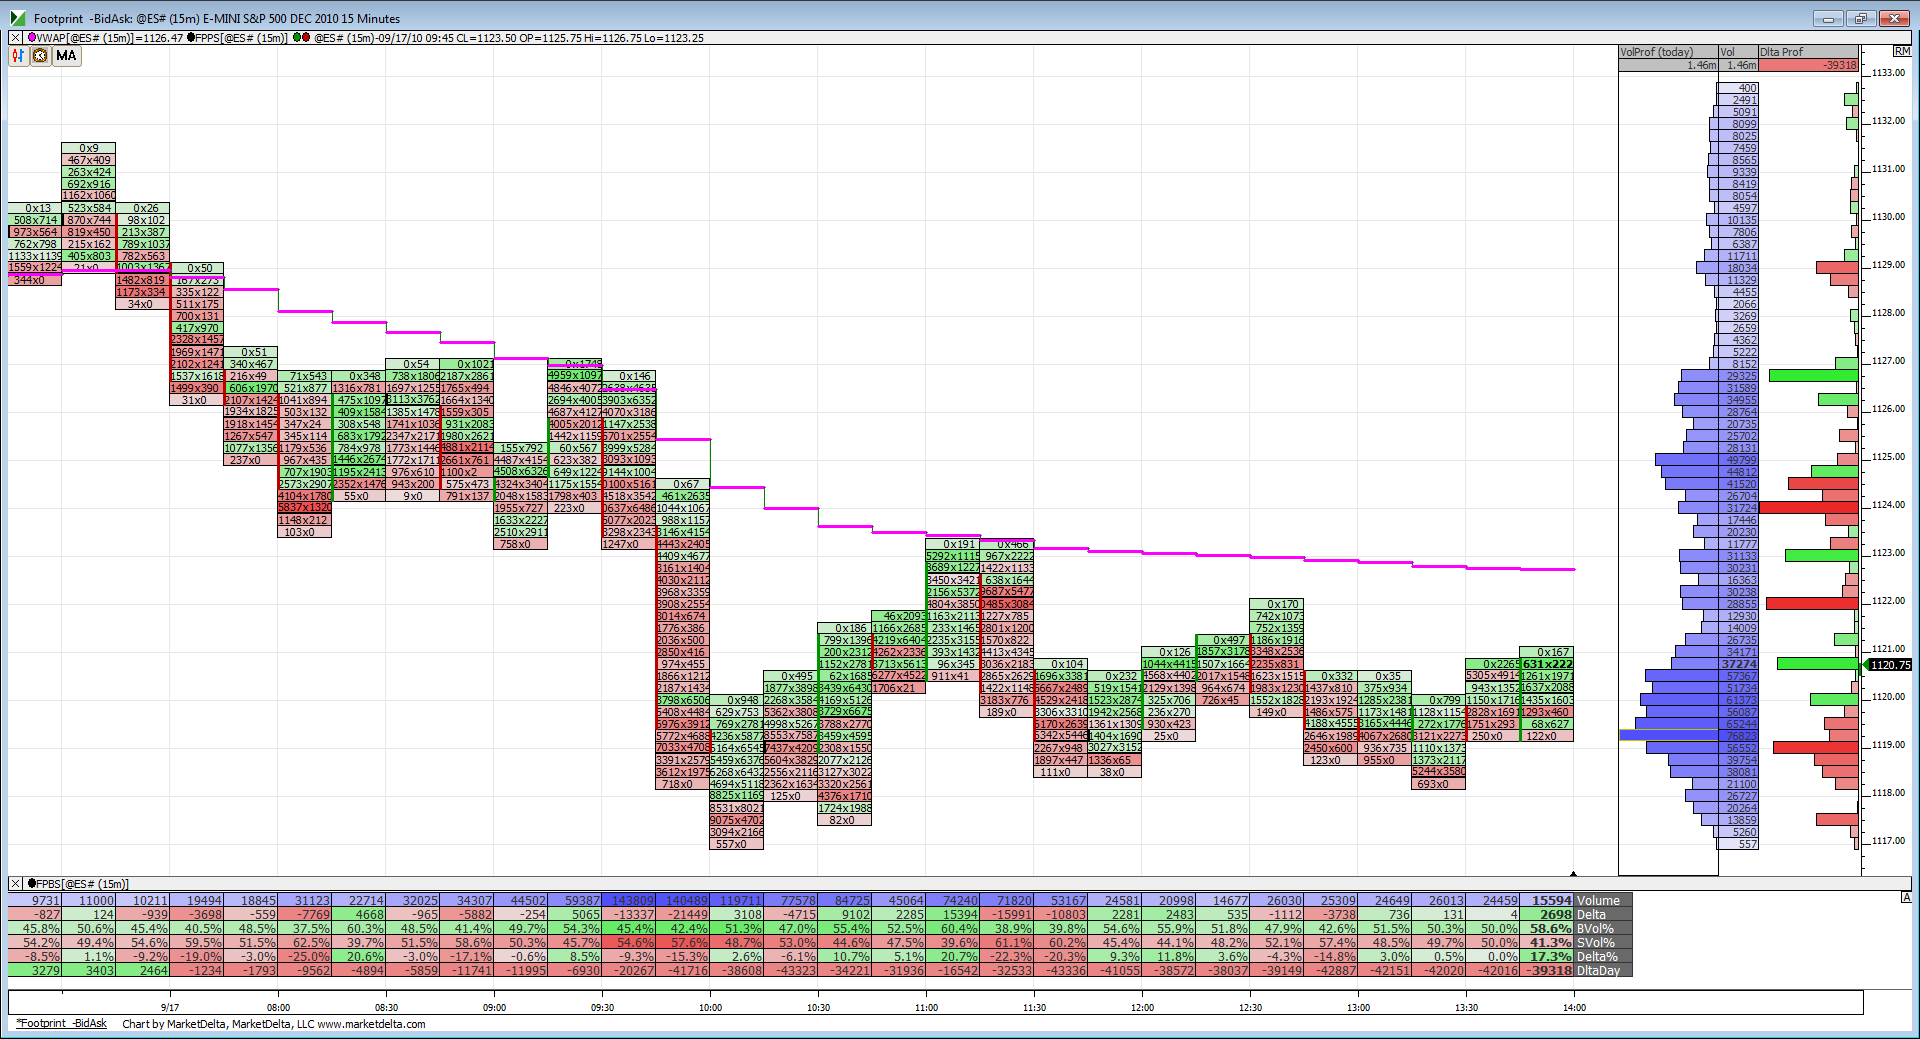
Kinda similar looking structure here during consolidation as we had yesterday. Question is will things break upward or downward. Considering its Friday maybe they won't break at all.
I've got the developing VAH at 1122.25 and VAL at 1117.75 which is the upper and lower boundaries of this range.
I've got the developing VAH at 1122.25 and VAL at 1117.75 which is the upper and lower boundaries of this range.
mark em for expiration at the close.
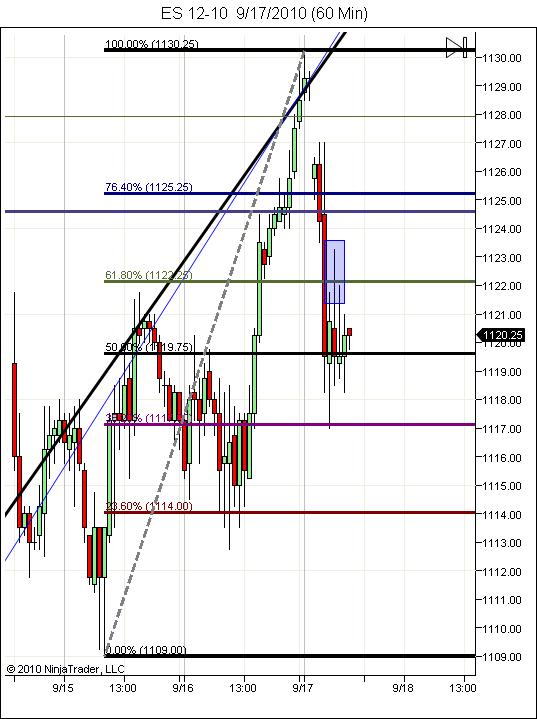
I've got 1120.25 as th 50% retrace from low to 1123.25.
I've got 1119.75 as the 50% from 1109 to 1130.25. Need to bust that box for a ramp into close.
I've got 1120.25 as th 50% retrace from low to 1123.25.
I've got 1119.75 as the 50% from 1109 to 1130.25. Need to bust that box for a ramp into close.
Good observation David.
Emini Day Trading /
Daily Notes /
Forecast /
Economic Events /
Search /
Terms and Conditions /
Disclaimer /
Books /
Online Books /
Site Map /
Contact /
Privacy Policy /
Links /
About /
Day Trading Forum /
Investment Calculators /
Pivot Point Calculator /
Market Profile Generator /
Fibonacci Calculator /
Mailing List /
Advertise Here /
Articles /
Financial Terms /
Brokers /
Software /
Holidays /
Stock Split Calendar /
Mortgage Calculator /
Donate
Copyright © 2004-2023, MyPivots. All rights reserved.
Copyright © 2004-2023, MyPivots. All rights reserved.


