Emini S&P Trading Using Elliott Wave Principle
Hi all.
I am new to the forum and have started this thread to discuss trading the E-mini using the Elliott Wave Principle. I desire a high quality discussion.
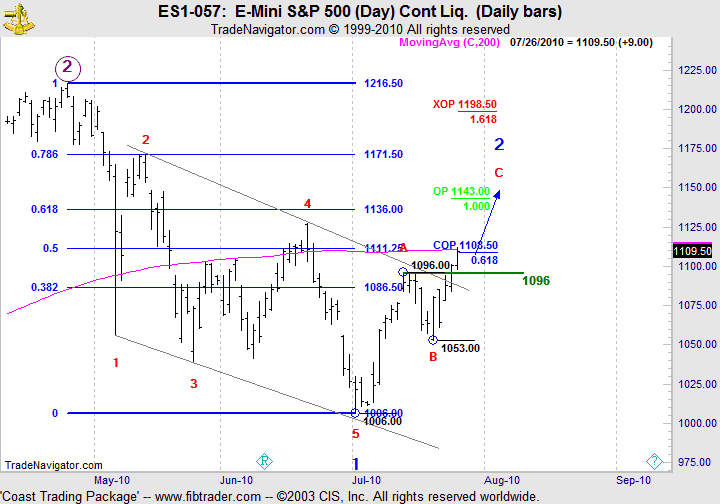
I have attached the daily chart containing my operative count as a starting point of the discussion. I believe that the decline from 1216.5 was a Leading Diagonal rather than a 5 wave decline. We are currrently working minor wave 2 up in a zig-zag.
I'm looking forward to everyone's comments.
Thanks David. Well said.
Originally posted by DavidS
Hi to both of you, DT and EWT,
Having subscribed to some EW analysis before I would like to offer an opinion. (Yeah, I know anatomy.) I'm not a great elliotician, but work with it.
In previous encounters with these services, the best to me, did not debate the waves. The provider simply posted labeled charts displaying their preferred count, with the logic behind it also posted. Also the minimum target levels if correct with the wave rules and guidelines behind it. Some provided a mention of their alternate counts, but only briefly as their expertise was such. Also included were the parameters for disqualification of the existing count or wave.
A proficient analysis follows the rules to a T. I've never personally seen one violated on a chart. Also the guidelines, which are not carved in stone, assist in the analysis. Pointing out the difference helps the reader to more completely benefit from the analysis.
Correct identification of the waves is the goal as it, and it alone, provides for the predictable forecasts. That's the goal.
I would recommend posting a daily submicro chart using the hourly as described above with pertinent info such as rules and guidelines involved. Where you post it is not important. I would leave off any trading reference. Facts and analysis only.
Most services would post a daily/weekly chart every 2-4 weeks for the larger picture with equally based logic using EW to explain the analysis.
I don't know or care if you trade EWT. I have often wondered in the past why people that posses such knowledge don't just make themselves rich. The guy that ran my favorite analysis site quit after he did just that. It's the same with those that run sites or write books.
If you want to contribute intraday, there are the other forums. I think you'll find it a slippery slope compared to analyzing an hourly chart. I completely understand what you posted today here. I wasn't looking here for it though during the day. I don't know if others would benefit. I think it can take one quite a while to latch onto the inherent value involved in the theory. I think I have described what a non EW user would eventually pick up on. I'd recommend that unless you just want to trade. You could post it in the daily forum in the AM. Any value will eventually come out there for others. I'm sure you'll be critiqued no matter what. :)
I hope this helps to maintain an interest here somewhere. Thanks for reading it.
David and DT - Thanks for the reply.
So it appears that we have two camps. One, that wants analysis only and a group that wants to see how a trader makes money with the discipline.
As I mentioned to DT, traders should make their own decisions. I have given much thought to posting my trades and I have come to the conclusion that it will not help the readership because everyone has their own trade plan. This is the difficulty that DT mentioned and making the forum topic relevant. So I've decided to just post the charts, with targets and explanation of analysis.
I would like to mention a few points. First, any trader who is willing to share his concepts regarding market timing and turning points is subject to more scrutiny than others. I expect no less but I am going to stand behind the body of work. I will make mistakes and admit failure. However, there is no system or trading method is infallible. If anyone knows of one, please drop me a line.
Secondly, here's something that may help the readership understand how to apply the principle to their trading. If the forum moves forward with this premise then traders may see value in the postings.
1. EW is not a trading plan in itself. EWI explicitly will tell you that if you ask them. I will agree with that, especially during corrective phases.
2. Best use of EW is to use it to identify possible turning points in the market that are in agreement with your trade plan. For example, I am a Fib trader. My success was initially limited because I leaned on these areas. Sometimes these levels of agreement and/or confluence only produced minor bounces or the position got run over. Occasionally I caught a runner on trend days. I quickly realized that I had to learn more about the market's directional moves in order to explain why certain Fibonacci levels were disrespected (see failure comment below) while others were not. That's when I found EW.
Since that time, the wave principle confirms which fib levels have a greater probability of being respected, i.e. by the count. A simplistic view of my plan is: When the count, EW targets and the market's fib levels are in agreement, I take notice and act because the odds are that I have a high probability trade set up.
There are other market participants that influence the market. For example, If I see pivot points that also are in agreement with my analysis, I take even more notice as I've got two groups of traders looking at the same set of numbers making the level even more significant. There are the candle traders. Should I get candle patterns that confirm the same area, again, two sets of traders, maybe three, looking at the same levels. I'm not being arrogant but think about what I just said. When a group(s) of traders act upon the same levels, what can also occur? Failures, as larger participants feed upon those trading groups to further drive the market in their desired direction. My point is we're all looking at certain levels of price and making our decisions. Regardless of a method or trade plan, if traders give EW a chance, it might confirm one of your entries exists or locate possible areas of failure for one to exploit. That's when the light bulb went on for me. I have (2) examples that illustrate the significant areas, failure and feeding on traders. I will post them after the market closes. One is the exploitation of MACD players and the other is actually where EW traders got taken.
In closing, I feel that the EW count helps me better align myself with larger players. After all, it's our job to befriend them by joining right in with them.
Hope this helps.
Best of Trading
In my previous post I said " I have (2) examples that illustrate the significant areas, failure and feeding on traders. I will post them after the market closes. One is the exploitation of MACD players and the other is actually where EW traders got taken."
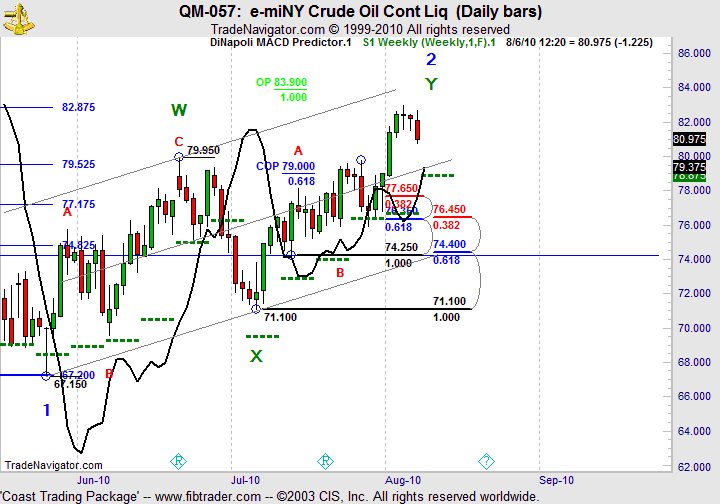
EXAMPE 1: The first chart is a recent daily chart of mini crude. The analysis was done from the high made on 7/27/10, so I didn't know in advance what was about to transpire. Looking at the chart, you'll note that I had labeled the market's fib retracements. Confluence (76.35-76.45). Also note the Weekly Pivot S1 (76.375) also agreed with the fib retracements. This created an area where (2) groups of traders were looking at. My count suggested a W-Y-Z, double three with upside potential. Targets most typically associated with the pattern are: Wave W = Wave Y at 83.90.
From the high on 7/22/10, the decline suggested a three wave structure, possibly an expanded flat (3-3-5)(not labeled) was unfolding that completed right into the support zone.
You'll see a dark black indicator on the chart, the MACD P (also referred to as a stop grabber). It shows me the price where the MACD will turn in advance. That point is where the line crossed the doji candle. Larger players pushed the market down, hunting stops. As the MACD turned to sell, these larger participants bought those stops, and MACD traders who took the sell were stuck with losses and covered as the signal reversed. Fib and pivot traders were also buying this area so the fuel was added to the fire for an upside move.
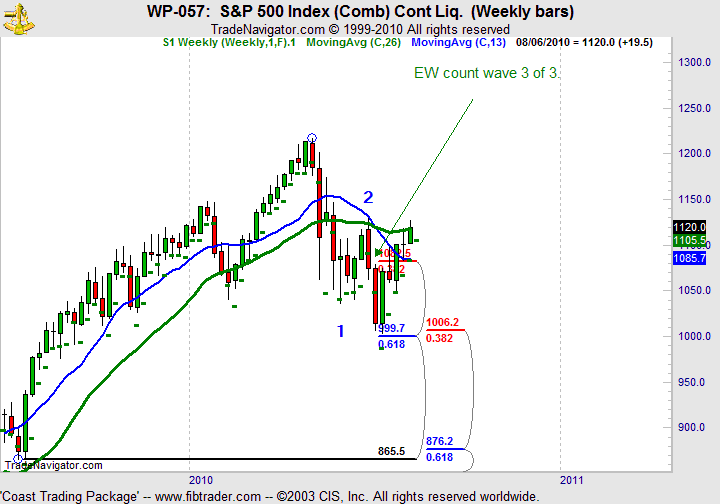
EXAMPLE 2: The weekly E-mini S&P chart illustrates how EW traders got caught at a major support level. The consensus opinion from EWI at the time was that the operative count was a 3rd of a 3rd. The chart is labeled as such. Fib levels at 999-1006 were deep support and WS1 pivot support came in at 987. As trade developed, the wave pattern produced 3 waves down from wave 2 blue (1129.2) with a termination point right in the support zone. A 3 wave structure is considered corrective not impulse (a 5 wave pattern) according to Elliott rules. Therefore the move down can't be counted as 3 of 3 and the count is wrong. Every elliotician that was looking for a 5 wave decline and got caught. In my opinion this was a failure to an elliotician but a logical buy area to a fib trader. Either way, the wave principle confirmed that the decline was over at a significant area.
I hope these two examples bring some insight into how I'm using the method.
EWT;
In a prior post I said it made no difference to me
if you called a trade or not. This is not only you
but anyone... I'am not interested in another traders
trades..I am interested in an area or # that is called.
I will look to my own chart for my own decision.
In a prior post I said it made no difference to me
if you called a trade or not. This is not only you
but anyone... I'am not interested in another traders
trades..I am interested in an area or # that is called.
I will look to my own chart for my own decision.
I found something interesting in my weekly review. On the weekly chart there may be a H&S building. If this is correct, the right shoulder may complete @ 1146 where wave A = wave C.
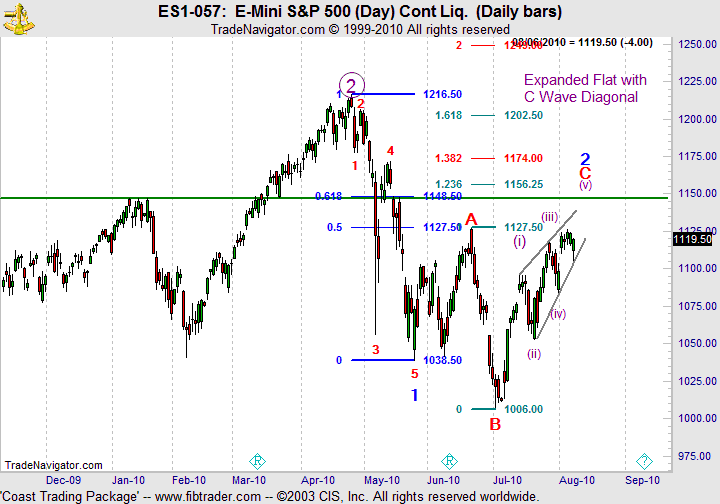
On the daily chart level, I am working two scenarios (a double 3: W-X-Y) and (an expanding flat with a wave C diagonal) for the current advance. I'll attach the chart for the expanded flat. The Double 3 has been posted in the forum a few days ago. What's important to know is that it doesn't matter which way you label the chart at this point. Both interpretations have the same implications when completed and offer similar targets for the termination of wave 2 (blue). Several termination points are in close proximity or in agreement with the weekly analysis.
Key EW resistance levels to watch for next week are: 1136, 1143-1149.25. 1152.85 - 1156.25. I will post the intraday wave C diagonal fibonacci clusters before the market opens on Monday. Together, they should provide areas of confluence that narrow the range for the termination of wave 2 (blue) and coincide with the larger time frame analysis.
On the daily chart level for each interpretation, a break below the lower trend line and a break of key support (1084.5) would mean that the current wave labeling was incorrect. A break of critical support (1053) would most likely mean that wave 2 (blue)had ended.
Best of Trading
On the daily chart level, I am working two scenarios (a double 3: W-X-Y) and (an expanding flat with a wave C diagonal) for the current advance. I'll attach the chart for the expanded flat. The Double 3 has been posted in the forum a few days ago. What's important to know is that it doesn't matter which way you label the chart at this point. Both interpretations have the same implications when completed and offer similar targets for the termination of wave 2 (blue). Several termination points are in close proximity or in agreement with the weekly analysis.
KEY DAILY NUMBERS ABOVE THE MARKET TO WATCH
Key EW resistance levels to watch for next week are: 1136, 1143-1149.25. 1152.85 - 1156.25. I will post the intraday wave C diagonal fibonacci clusters before the market opens on Monday. Together, they should provide areas of confluence that narrow the range for the termination of wave 2 (blue) and coincide with the larger time frame analysis.
Where The Analysis Fails
On the daily chart level for each interpretation, a break below the lower trend line and a break of key support (1084.5) would mean that the current wave labeling was incorrect. A break of critical support (1053) would most likely mean that wave 2 (blue)had ended.
Best of Trading
Originally posted by EWT
Key EW resistance levels to watch for next week are: 1136, 1143-1149.25. 1152.85 - 1156.25. I will post the intraday wave C diagonal fibonacci clusters before the market opens on Monday. Together, they should provide areas of confluence that narrow the range for the termination of wave 2 (blue) and coincide with the larger time frame analysis.
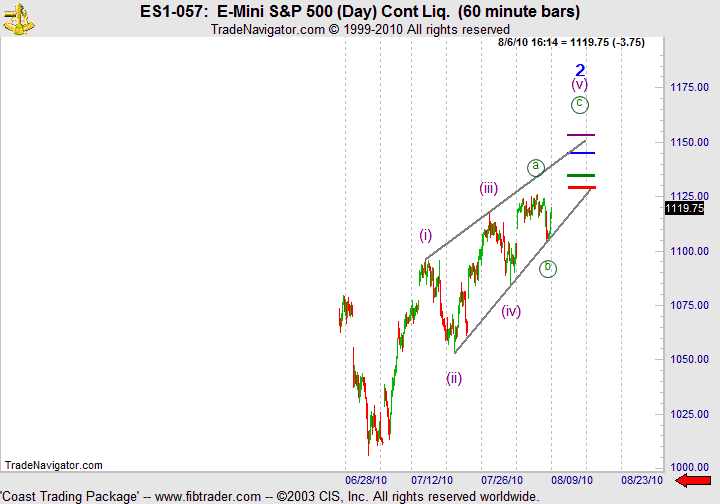
Here are the additional EW Fib levels and color codes created from the intraday 60 minute chart.
Red- wave c =.618 wave a @ 1129.5
Green- waves (i) - (iii) = .618 @ 1133.5 (Golden Section) of the entire wave 2.
Blue- wave c = wave a @ 1145.25
Purple - wave (v) = .618 wave [(i)-(iii)]@ 1153.5
Price came within 2.5 points of the inital target of 1129.75. It remains to be seen if a new recovery high can be struck or if wave 2(blue) has ended. The current interpretation of the wave count from 1103.75 is open but the ending diagonal and its structure is still intact. All Fibonacci targets remain in place.
I'm moving key support to 1113.25. If prices breach this mark, then something is wrong with my count and or the diagonal interpretation. I'll set critical support to 1103.75.
Best of Trading
I'm moving key support to 1113.25. If prices breach this mark, then something is wrong with my count and or the diagonal interpretation. I'll set critical support to 1103.75.
Best of Trading
Originally posted by EWT
I'm moving key support to 1113.25. If prices breach this mark, then something is wrong with my count and or the diagonal interpretation. I'll set critical support to 1103.75.
Best of Trading
Correction - Key support is 1108.25
The market is at a key juncture from an Elliotticion's point of view. The O/N is trading heavy and price has reached critical support that I established at 1103.75. The significants of this level and the implications of a break have already been mentioned.
A few other points of consideration to supplement the previous analysis:
1. The Dow was the only indice to take out the June high. The S&P and Nasdaq failed to confirm this move.
2. The S&P and Nasdaq exhibit ending diagonal patterns (terminal patterns)that have not significantly resolved to the upside trend line... accompanied by a volume spike and higher breath.
3. Analysis in both Time Cycles, Fibonacci Time Ratios and Fibonacci Time Extensions provided the following dates for termination at the daily and intraday chart level (+/-) 1 trading day : 8/10, 8/11, 8/16, 8/17, 8/18. On an intraday basis, wave 1 (down) lasted 29 days and wave 2 (up) has lasted 76 days for a time ratio of .382.
As always, draw your own conclusions.
Best of Trading
Not seeing any way to really trade this but lots of numbers above and below the Market Mike......2.5 points to target and it misses so it goes back below 1113.....
We can pick random numbers and be just as accurate...eventually those will be accurate...sorry but this is proving what I thought all along.....it just doesn't work....it sells newsletters and books and seminars..
I'm not sure the world needs more numbers...we need less....!
I think the best way to build a following so you can eventually market something is to make market calls and have the ideas work over time....like we do in the ES threads.....except that we aren't selling anything.....should we ? Perhaps..
Good luck Mike....would you be posting this here and on Elite if you didn't have plans to sell stuff in the future ?
I'm not comfortable supporting a thread that has an ultimate goal of selling stuff ...I think Elite trader is a good place to keep this up...just my opinion..
good luck Mike
Originally posted by EWT
Price came within 2.5 points of the inital target of 1129.75. It remains to be seen if a new recovery high can be struck or if wave 2(blue) has ended. The current interpretation of the wave count from 1103.75 is open but the ending diagonal and its structure is still intact. All Fibonacci targets remain in place.
I'm moving key support to 1113.25. If prices breach this mark, then something is wrong with my count and or the diagonal interpretation. I'll set critical support to 1103.75.
Best of Trading
Well, I guess we have our answer...as expected EWT is giving us double talk and "dancing" around making those market calls...we know what that means.....he can't make money by trading EWT.
I have a good indication now that he has little respect for our forum and the people here. He doesn't need us and we certainly don't need him. I think it's time to let Elite trader and other forums figure him out.
I have a good indication now that he has little respect for our forum and the people here. He doesn't need us and we certainly don't need him. I think it's time to let Elite trader and other forums figure him out.
Emini Day Trading /
Daily Notes /
Forecast /
Economic Events /
Search /
Terms and Conditions /
Disclaimer /
Books /
Online Books /
Site Map /
Contact /
Privacy Policy /
Links /
About /
Day Trading Forum /
Investment Calculators /
Pivot Point Calculator /
Market Profile Generator /
Fibonacci Calculator /
Mailing List /
Advertise Here /
Articles /
Financial Terms /
Brokers /
Software /
Holidays /
Stock Split Calendar /
Mortgage Calculator /
Donate
Copyright © 2004-2023, MyPivots. All rights reserved.
Copyright © 2004-2023, MyPivots. All rights reserved.
