ES Short Term Trading 7/14/10
Mornin,
If there's another thread please let me know.
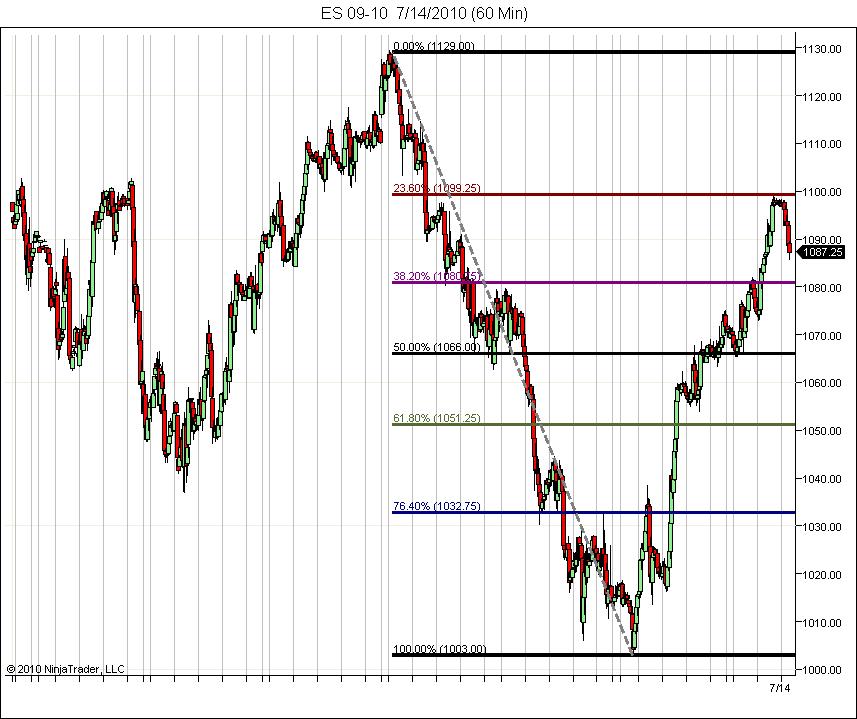
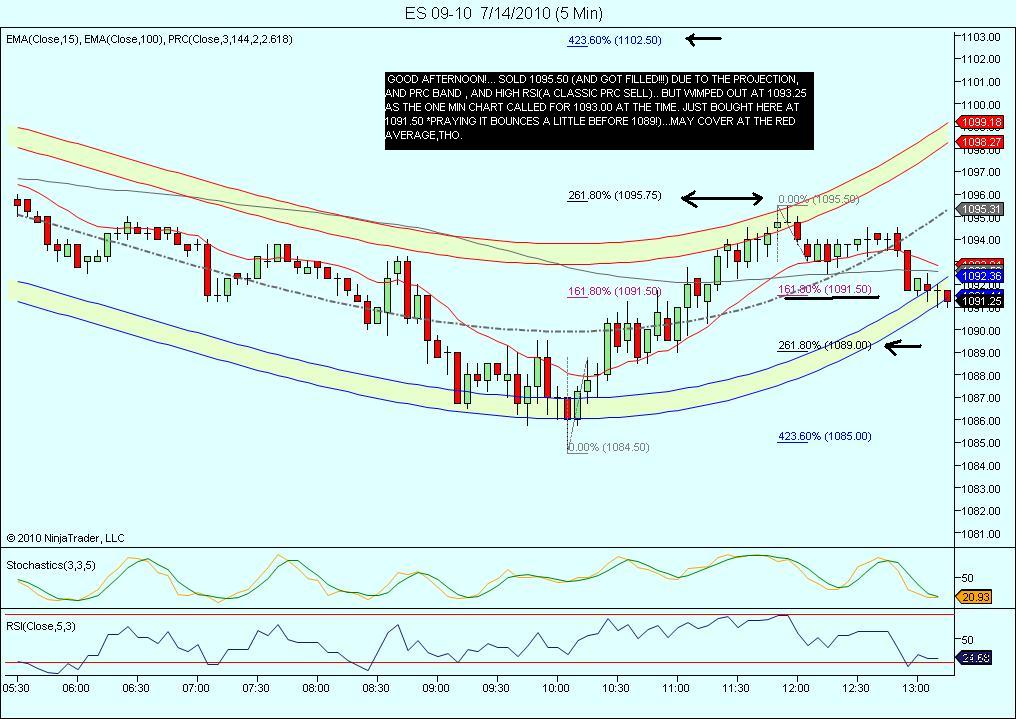
Here's a chart for you Bruce from your ah inquiry. Will post info for it later.
If there's another thread please let me know.
Here's a chart for you Bruce from your ah inquiry. Will post info for it later.
David...what I meant was that it's easy to snap fib lines at 1003 and 1130 after we start back up off the 1003....but how about if we had kept going down......? For you is it a process of snapping and redrawing lines with each move down..?
Nice $tick spike up lets hope that's enough to roll it over....we know that folks have a trend line up on those lowsw
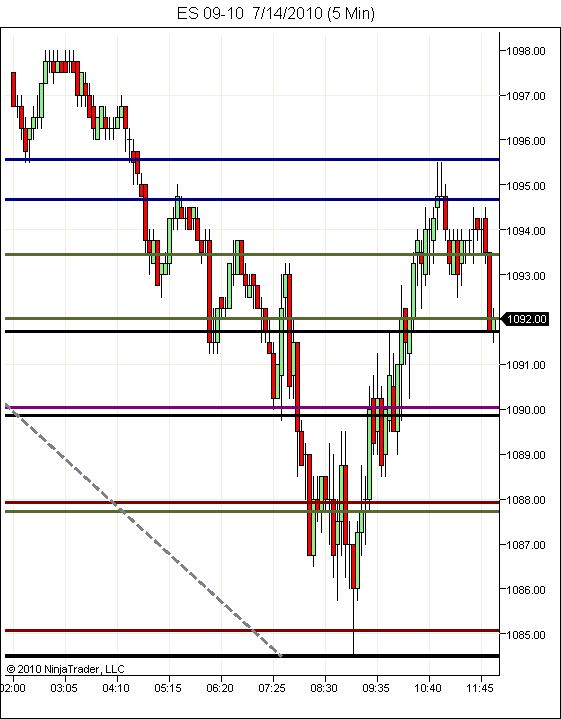
The 95 was a hugh volume spike when we reopened for trade at 4:30......that held the low and we built volume at 97.50 in the O/N session......they we rolled over down obviously....it's also near YD highs of RTH
not tthe greatest high but this low volume stuff seems to be forming them more...we need to adapt!!
longs will need to make new highs and not trade below 92.75 on THIS 30 minute bar in order to maintain long trend!!!
Bruce,
I don't really see how we're ever not in a range. I had that larger fib level drawn from the morning after the 1002 O/N low.I usually mark high's and lows regularly on the hourly.
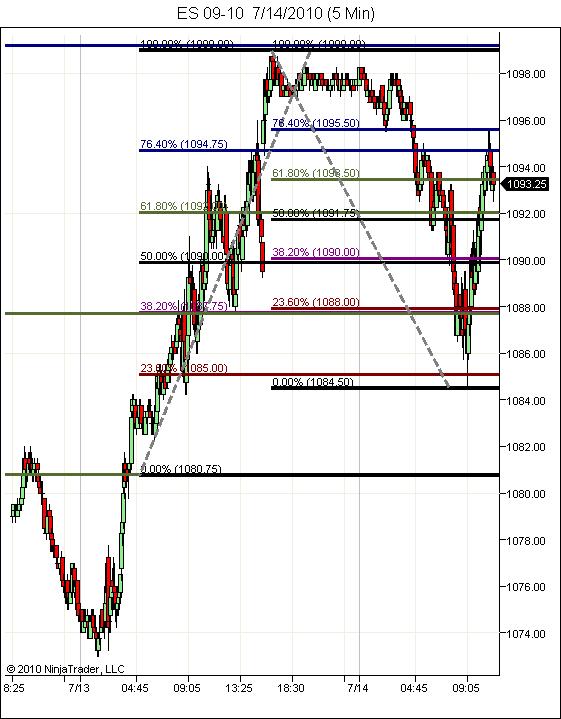
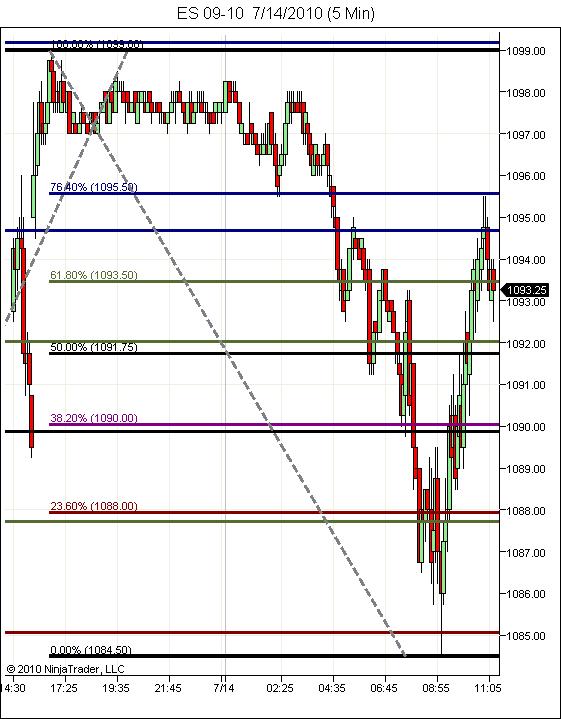
Here's my 5 min fib chart today. One is the fibs inside the larger fibs from the earlier chart. The other levels are also from the earlier chart(another wave to eval). They just both on the same chart on the same chart now.
Note the congestion/battles occurring at the double line areas. I put em on as we go. Those haven't changed from the AM when I drew em.
Can incorporate them into a decision tree as one likes or not. Use em, don't use em. It's a tool. Takes time usually.
Dave any reason you use 76.4 verses 78.6?
Yes. If this is a B wave or a 2nd wave up from the AM low, I'll expand the fibs for the wave as needed to the bottom of C when it completes at a new low.
My fib extension tool is messed up from my NT problems last thur and fri, but one can put on extensions for projections. Another time.
My fib extension tool is messed up from my NT problems last thur and fri, but one can put on extensions for projections. Another time.
I don't do em on a 1 min chart but you could for each wave as you "drilled down" as you say.
Lorn,
I use it because it's what I have on NT and I like it better. The 78% I'm aware of and I'm looking for a spike reversal or confirmation if the 76 is pierced.Plus the inverse of 23.6 I like better.
Lorn,
I use it because it's what I have on NT and I like it better. The 78% I'm aware of and I'm looking for a spike reversal or confirmation if the 76 is pierced.Plus the inverse of 23.6 I like better.
...ULTIMATE UPSIDE TARGET IS 1102.50-.75...Today is the 11th trading day of the month... refer to the seasonal chart from Mike Burk
in that case Rburns it was the one minute volume spikes !!!If I had my I r/t up at that time it would have helped refine it a bit...but look at all one minute volume spikes begining with the open spike..!all the major ones came in the same zone today....so 87 - 89 is still critical!
Emini Day Trading /
Daily Notes /
Forecast /
Economic Events /
Search /
Terms and Conditions /
Disclaimer /
Books /
Online Books /
Site Map /
Contact /
Privacy Policy /
Links /
About /
Day Trading Forum /
Investment Calculators /
Pivot Point Calculator /
Market Profile Generator /
Fibonacci Calculator /
Mailing List /
Advertise Here /
Articles /
Financial Terms /
Brokers /
Software /
Holidays /
Stock Split Calendar /
Mortgage Calculator /
Donate
Copyright © 2004-2023, MyPivots. All rights reserved.
Copyright © 2004-2023, MyPivots. All rights reserved.
