ES Short Term Trading 6-7-10
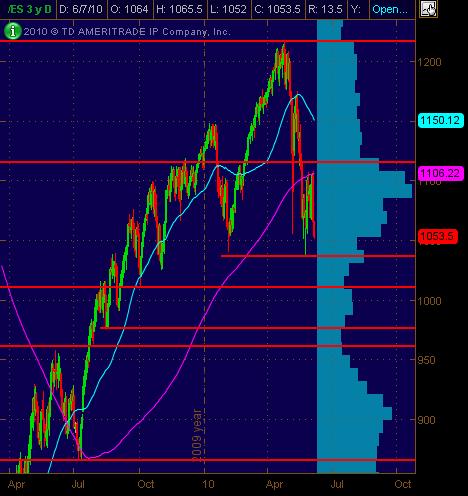
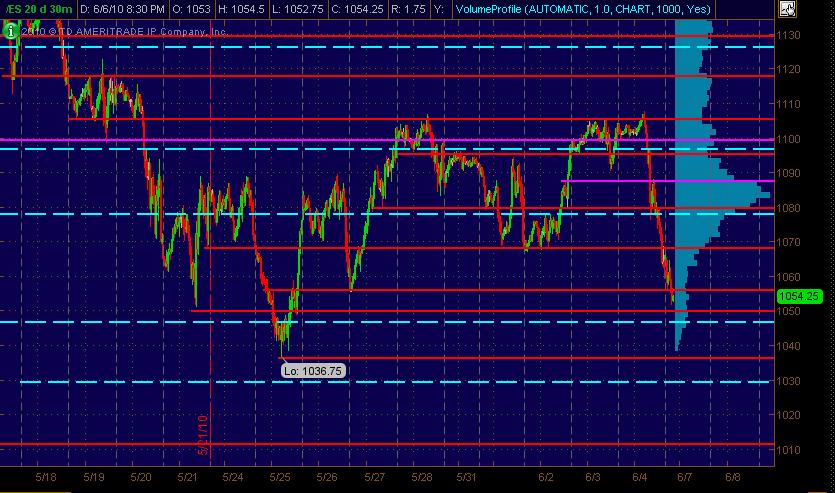
Here's my charts with Price Action S/R levles ... significant ones in Red and semi-significant in Magenta. The Cyan dashed lines are the Weekly Pivot levels.
First is the Daily ES chart:
And the 30-minute bar chart of 20 days:
First is the Daily ES chart:
And the 30-minute bar chart of 20 days:
rats seem to get blown thru a lot in the last hour.
some will look at double TPO's printing below 56 as a further sign of decline.......so us shorts will be watching the 3:30 close and next bar open..
out on 3 at 51.75.....no place for stop on last two...above single prints?? good volume and close below key 56 number...we'll see...they should still test a previous 30 minute high is concern for this short
agree feng...and air pockets fail ( don't fill) so that tells us about the ability for the market to trend late in the day...
Originally posted by feng456
rats seem to get blown thru a lot in the last hour.
55.25 will take out these two...so hard to catch a trend....so much back and fill
anyone have a good target besides the 50 RAT..?
done at 49.75...no clue now..just thought that woukld have moved faster...50 is major RAT...so not sure...done for today
a bad close below that spike bars low leads me to believe that the 38 - 37.50 will be tested soon...
Originally posted by BruceM
a bad close below that spike bars low leads me to believe that the 38 - 37.50 will be tested soon...
probably overnight eh?
Emini Day Trading /
Daily Notes /
Forecast /
Economic Events /
Search /
Terms and Conditions /
Disclaimer /
Books /
Online Books /
Site Map /
Contact /
Privacy Policy /
Links /
About /
Day Trading Forum /
Investment Calculators /
Pivot Point Calculator /
Market Profile Generator /
Fibonacci Calculator /
Mailing List /
Advertise Here /
Articles /
Financial Terms /
Brokers /
Software /
Holidays /
Stock Split Calendar /
Mortgage Calculator /
Donate
Copyright © 2004-2023, MyPivots. All rights reserved.
Copyright © 2004-2023, MyPivots. All rights reserved.

