ES Short Term Trading 6-7-10
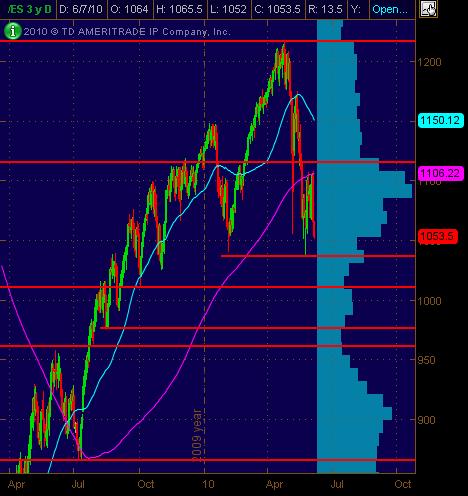
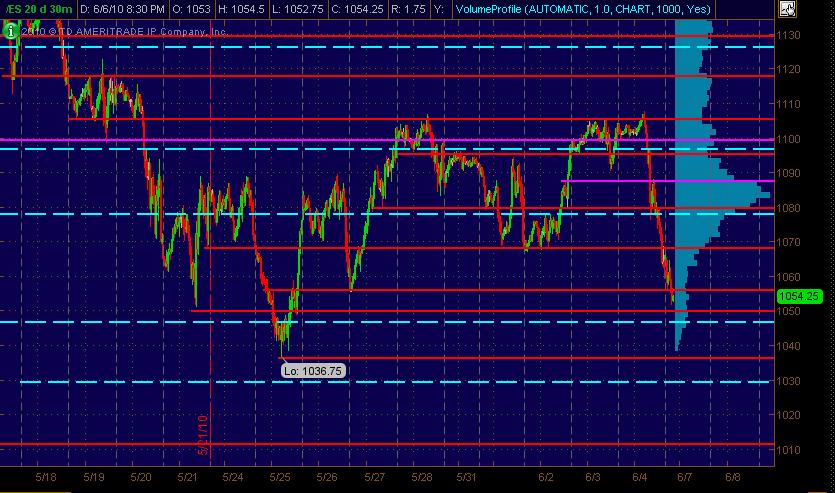
Here's my charts with Price Action S/R levles ... significant ones in Red and semi-significant in Magenta. The Cyan dashed lines are the Weekly Pivot levels.
First is the Daily ES chart:
And the 30-minute bar chart of 20 days:
First is the Daily ES chart:
And the 30-minute bar chart of 20 days:
Originally posted by phileo
Originally posted by feng456
im going to short the open.
Hi Feng,
Did you keep a runner on ?
nope. it's not in my plan and i cant afford it anyway. also this is more of a testing month than anything.
Originally posted by phileo
Originally posted by PAUL9
wow, got that extreme neg $tick reading right at the rat.
Dang.... 1061 might be the RTH LoD.....
did anyone go long ??????
and now we have a +ve TICK extreme tagging 1067. Just adds more evidence to 1061 being RTH LoD.
So maybe we have a new kind of setup here:
TICK extreme into a resistance/support level (does prior day have to be a trend day for this to work ? I am suspecting not)
so far we are getting what we all needed and expected...the buythe breaks, sell the rallies day..anyone trying the 68.75's???
Bruce what do we look for before we buy or sell a Rat#. Just standing in the way of a rising tide or falling knive is kind of crazy, right!!!!
AH hit (not really that unbelievable) 70.75, to the tick.
70.75 was Low from last week RTH before Friday.
might need to see it now
Phileo, I absolutely agree with the extreme neg at Bruce rat regardless of failure to see Miller Gap down after monster decline, plus at the simplest, most rudimentary interpretation of PA, price tested area of Friday support and experienced a reversal whether it is a scalp bounce or the beginning of legs up, don't know...
Markets always look for confirmations of both support and resist.
Originally posted by BruceM
so far we are getting what we all needed and expected...the buythe breaks, sell the rallies day..anyone trying the 68.75's???
No, no shorting for me.
Not at least until the TICK weakens.
TICK has been quite strong ever since 1061.... confirms P/A.
I think 1078 is today's target.
FYI, today is mutual fund Monday.
Originally posted by phileo
Originally posted by BruceM
so far we are getting what we all needed and expected...the buythe breaks, sell the rallies day..anyone trying the 68.75's???
No, no shorting for me.
Not at least until the TICK weakens.
TICK has been quite strong ever since 1061.... confirms P/A.
I think 1078 is today's target.
FYI, today is mutual fund monday.
long 1063.5 target 1070, stop 1061
out 1061.5, -2pts
I agree AK1 but I do it sometimes with a good setup....The RATs are more of a concept then a trade setup....Would you buy an air pocket that closes below a RAT...? Look what happened below 62.50 and the air pockets that sat above the market. Where are the pitbull numbers....The rats are a concept and you have noticed that ALL key nunbers come in at those usually...Like the 68.75 - 70.....would you sell after a Doji and an inside bar up into the 68.75 ratchet, the O/N high and the VA low of 70..? Did we get an FEB setup on the 5 minute to go short if you need an entry pattern besides the others....where were the $ticks...hopefully this gives you ideas...
Some like entry bars....I'm not here to tell anyone to take specific trades as I know all have different risk tolerences and goals..we know so far rhat it is a "Z" day ..especially after a trend....they need to work off excess...we know they will bust a hour high or low and get a previous days low or high...so I incorporate it all and work try to get runners to the bigger targets
We know rats will print so how you get them is up to you.. I like the failures....anyone buying a Rat will try to get 3 points above or below one.....where was the highs and lows of the 15 minute bars today?
So we took out YD lows....which is good , now we need to see what happens...hope that helps.....as traders sometimes we need to think like Brainiacks....until it becomes second nature..
Originally posted by ak1
Bruce what do we look for before we buy or sell a Rat#. Just standing in the way of a rising tide or falling knive is kind of crazy, right!!!!
What happens if they can't get to a RAT...like 56.25....then a goodlong signal will get to 62.50 again...try thinking about the concept...the RATs aren't perfect ...is anything?
FWIW, If A up from the 1052.00 low is 18.75 points and the move down to 1058.25 is B, then c=a at 1058.25plus 18.75 =1077!
Originally posted by BruceM
a bad close below that spike bars low leads me to believe that the 38 - 37.50 will be tested soon...
probably overnight eh?
Emini Day Trading /
Daily Notes /
Forecast /
Economic Events /
Search /
Terms and Conditions /
Disclaimer /
Books /
Online Books /
Site Map /
Contact /
Privacy Policy /
Links /
About /
Day Trading Forum /
Investment Calculators /
Pivot Point Calculator /
Market Profile Generator /
Fibonacci Calculator /
Mailing List /
Advertise Here /
Articles /
Financial Terms /
Brokers /
Software /
Holidays /
Stock Split Calendar /
Mortgage Calculator /
Donate
Copyright © 2004-2023, MyPivots. All rights reserved.
Copyright © 2004-2023, MyPivots. All rights reserved.

