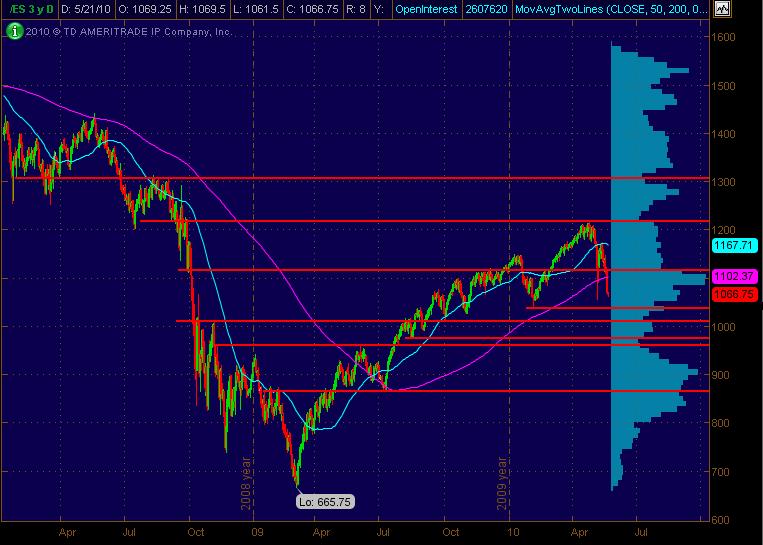
ES Short Term Trading 5-21-10
With the mkt getting so volatile and funkadelic, thought I'd just go to the big picture with a Daily chart showing the 50 and 200 day sma's along with what I'm seeing as significant Price Action S/R levels in Red. The chart is a 3-year Daily (Continuous Contract) chart including a Volume Profile.
Don't really see a pattern of classical or more recent origin other than a potential forming of a Head and Shoulders ... potentially a "Rolling" H&S. For the short and even intermediate term (almost), the mkt is "oversold" ... whatever that truly means.
But since the Flash Crash and all the subsequent volatility and erratic price movement, it's even more challenging with Op-Ex Friday. I still think that MP has been describing the market the best, especially as translated by BRUCE!
Don't forget to also track intraday the NQ and YM, looking at relative strength or weakness compared to the ES. Others have commented on NQ being a leading/early-warning of where the ES might travel during the trading session.
So here's the chart. Fyi, I trade stocks mostly and this functions as a market map for me ... which is also why I don't post much intraday unless I'm more focused on and TRADING the ES.
thanks guys...although not on this long , the fact that they held that68.75 leads me to believe that they want the hour high and the 81.75 area...obviously we don't want the 75 to fail a third time
a simple and basic truth...a failure up at the 81.25 number will go back to 75.....IF they can hold itthey will try for 87.50....chart later as an experimental concept I'm working from
on the 87.50 print for 81.50 ultimately...tight stop....I want to have a life today
stopped at 87.. I missed my exit point...trending ....is 93 area next
trying again for the air and then the 81.50 AREA
GOT THE 84 AIR ZONE...CAN THEY GET 81.50 before the 87.50 again???
I will have an incorrect read on the profile if they don't test that 75 area after 2:30 opens...
MKT at 79.75
MKT at 79.75
seems like they will want to fill in between 81.25 and 75 now...
Guys what is a good way (maybe tried and tested personal experience?) of raising one's confidence?
Originally posted by feng456
Guys what is a good way (maybe tried and tested personal experience?) of raising one's confidence?
Feng, I tried to answer your question here:
http://www.mypivots.com/Board/Topic/5713/1/how-to-build-confidence
I thought it would be better as its own thread, so as not to hijack this one, and to have it where more people would read it.
Emini Day Trading /
Daily Notes /
Forecast /
Economic Events /
Search /
Terms and Conditions /
Disclaimer /
Books /
Online Books /
Site Map /
Contact /
Privacy Policy /
Links /
About /
Day Trading Forum /
Investment Calculators /
Pivot Point Calculator /
Market Profile Generator /
Fibonacci Calculator /
Mailing List /
Advertise Here /
Articles /
Financial Terms /
Brokers /
Software /
Holidays /
Stock Split Calendar /
Mortgage Calculator /
Donate
Copyright © 2004-2023, MyPivots. All rights reserved.
Copyright © 2004-2023, MyPivots. All rights reserved.
