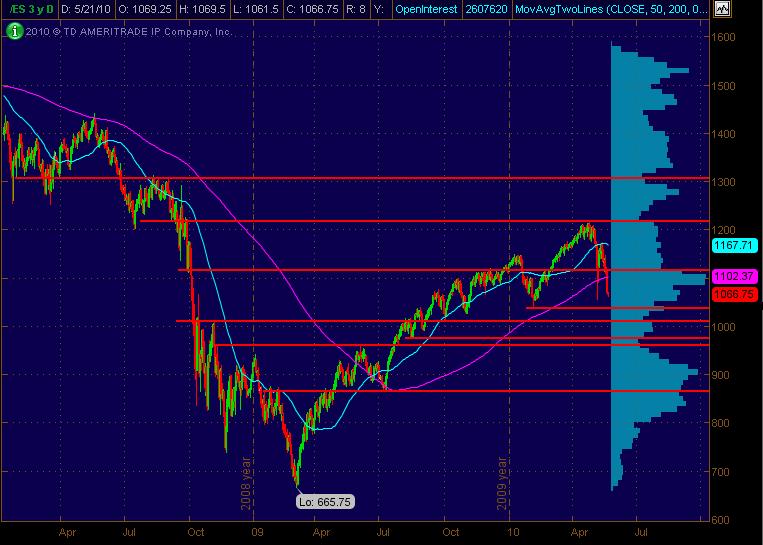
ES Short Term Trading 5-21-10
With the mkt getting so volatile and funkadelic, thought I'd just go to the big picture with a Daily chart showing the 50 and 200 day sma's along with what I'm seeing as significant Price Action S/R levels in Red. The chart is a 3-year Daily (Continuous Contract) chart including a Volume Profile.
Don't really see a pattern of classical or more recent origin other than a potential forming of a Head and Shoulders ... potentially a "Rolling" H&S. For the short and even intermediate term (almost), the mkt is "oversold" ... whatever that truly means.
But since the Flash Crash and all the subsequent volatility and erratic price movement, it's even more challenging with Op-Ex Friday. I still think that MP has been describing the market the best, especially as translated by BRUCE!
Don't forget to also track intraday the NQ and YM, looking at relative strength or weakness compared to the ES. Others have commented on NQ being a leading/early-warning of where the ES might travel during the trading session.
So here's the chart. Fyi, I trade stocks mostly and this functions as a market map for me ... which is also why I don't post much intraday unless I'm more focused on and TRADING the ES.
Im seeing 69 area as major resistance besides being the previous days close.
Also 75-6 if it gets thru 69.
Originally posted by rburns
Im seeing 69 area as major resistance besides being the previous days close.
I see the same area 1068.25 to 1069.25 is my resistance too and just in case I filter the resistance area with my RSI above 70 as an overbought zone 1 candle before my zone get printed.
scary scary mkt. watch out and be careful
61.25 is first magnet for me
a failure at this 56 number will run it down to the 50 but so far so good...same way of thinking that a break above will go for the 62.50
followed my plan. f*cked by my laptop again.
Wow if you never seen volatility now is the moment.
The market is in a huge reversal session taking out all the gappers traders.
Originally posted by feng456
Guys what is a good way (maybe tried and tested personal experience?) of raising one's confidence?
Feng, I tried to answer your question here:
http://www.mypivots.com/Board/Topic/5713/1/how-to-build-confidence
I thought it would be better as its own thread, so as not to hijack this one, and to have it where more people would read it.
Emini Day Trading /
Daily Notes /
Forecast /
Economic Events /
Search /
Terms and Conditions /
Disclaimer /
Books /
Online Books /
Site Map /
Contact /
Privacy Policy /
Links /
About /
Day Trading Forum /
Investment Calculators /
Pivot Point Calculator /
Market Profile Generator /
Fibonacci Calculator /
Mailing List /
Advertise Here /
Articles /
Financial Terms /
Brokers /
Software /
Holidays /
Stock Split Calendar /
Mortgage Calculator /
Donate
Copyright © 2004-2023, MyPivots. All rights reserved.
Copyright © 2004-2023, MyPivots. All rights reserved.
