2 to 1
Wanted to offer the following in the hope that others might review with a constructive eye and, perhaps, conduct additonal backtesting. My technical abilities are limited, so I backtest manually.
The results for the 28 trading days between Apr 2 - May 12 on NQ June show 19 trades. 13 W 164 points 5L 29.75 points 1 BE. Gross of 134.25 points - $2685 before commission
Methodology
Chart set up: On a day session chart plot the 5 period average true range. Also plot a 5 period simple moving average of both the close and the open. Longs are taken only when the 5 period SMA of the close is above the 5 period SMA of the open. Shorts only when below.
Entries and Exits: If taking longs, add 50% of yesterday's ATR to today's open. This is the entry. Exits are either - a stop order at today's open, limit order at 50% of yesterday's ATR added to today's open, or MOC. For shorts simply reverse.
Having a target that is twice the stop really helped when I manually tested this for the same period as above on the 10 yr note (ZN June). 18 trades were taken. 8 W 83.5 points 10 L 47.5 points Gross of 36.5 points - $1140.62 before commission.
Thanks in advance for your constructive ideas for improvement and any additional backtesting you might undertake.
edit - 25% atr changed to 50%
Here is A copy of the Strategy
(Disregard Pivot Point Info)
The strategy gives you the option of using a 5 period ATR or a 5 period average of the Daily Range. Also allows you to try different percentages of the ATR ( or % of Avg Range)
JB
I'm not sure if the upload worked ... it is a MicrosoftWord File
(Disregard Pivot Point Info)
The strategy gives you the option of using a 5 period ATR or a 5 period average of the Daily Range. Also allows you to try different percentages of the ATR ( or % of Avg Range)
JB
Click link to access uploaded file:
ATR_Daily_Trend_Strategy.doc
ATR_Daily_Trend_Strategy.doc
I'm not sure if the upload worked ... it is a MicrosoftWord File
Upload worked fine. Thanks, John. Will review.
Paul,
Just want to check # 's with you :
ES Stopped out Buy 974 stop 970 (using Avg Range 15.75)
ES stopped out Buy 974.25 stop 970 (using ATR 16.15 )
no trades yet in ZN (I use symbol Ty)
Just to check Zn #'s :
Sell Bias
Using 5 period Average True Range (ATR) :
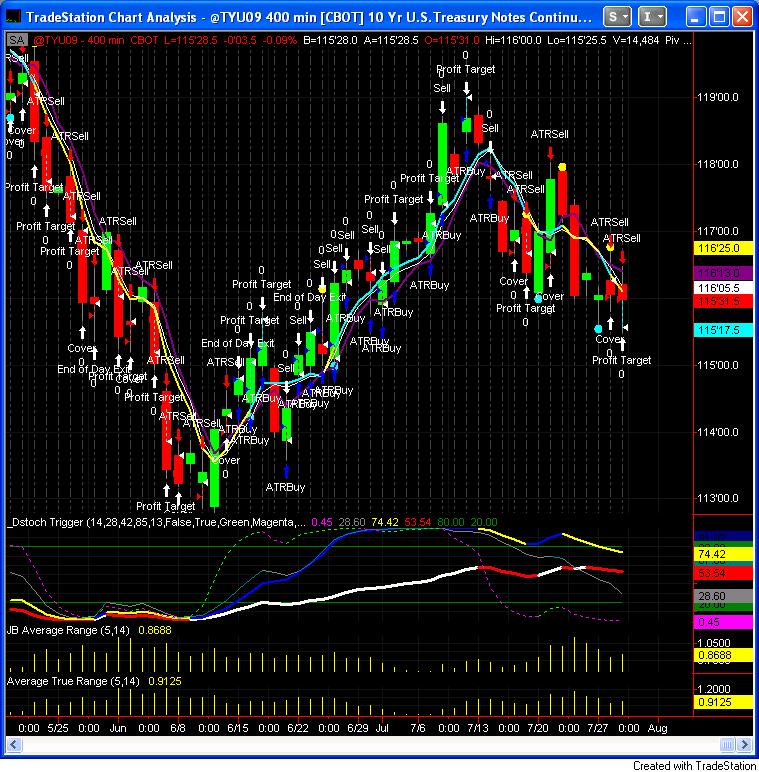
ATR 0.8688 (27.8 32nd) 8:20 open 116.065 ,
SellPrice 115.315 (open - (27.8 *.25))
Pft Tgt 115.175 (27.8 * .50 = 13.9 32's)
Using 5 period Average Range :
AvgRange .8250 (26.4 32nd) 8:20 open 116.065 ,
SellPrice 116.00 (open - (26.4 * .25))
Pft Tgt 115.1875 (26.4 * .50 = 13.2 32's)
John
Our numbers are slightly different.
For Es I have ATR 14.84 so long @ open of 969.75 + 3.75 = 973.50. Lost on that one. My 5 day average range is 13.25.
Nothing else has triggered.
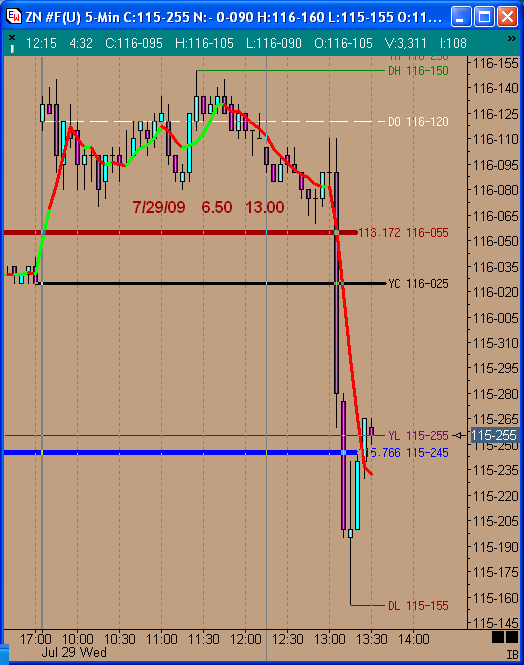
My ZN numbers: ATR 25.5/32's. Will short at 116-055 off open (9:30 AM ET)of 116-120 less 6.5/32's. Target is 115-245.
NQ numbers: ATR 26.93. Long off open of 1597 + 6.75 = 1603.75 with target of 1617.25.
Haven't done any stats on entries initiated in PM VS those in AM, but I have to admit getting a little itchy with PM entries. Would like the time for trades to work.
Were you able to generate results of backtesting issues other than ES?
Well my ZN trade triggered and hit the target. See the chart that follows. only problem...Iwasn't on it. My sell stop limit order was skipped over when a downdraft hit the market. Missed a profit of over $400 on that. Would have more than made up for the ES loss earlier and resulted in a nice profit for the day.
Doesn't show up in backtesting. Thankfully, this doesn't happen very often. But, I still let out a few expletives when it happened and I got left behind on a nice move.
Doesn't show up in backtesting. Thankfully, this doesn't happen very often. But, I still let out a few expletives when it happened and I got left behind on a nice move.
Hi Jbux!
I'm glad you have TS and are able to help Paul out.
He has asked a couple of questions and I haven't seen the answer
posted so I'm wondering about them.
1. You have different results than he does for the period of the
screen snap where you show individual trades. Have you figured out
if your calculations with TS are correct? i.e. computed a couple of days by hand to see if your tradestation results match your hand computations?
2. You mentioned look inside the bar. Are you only computing on
daily OHLC data? If you are using intraday data what time period are
you using (e.g 5 min bars)
Thanks.
I'm glad you have TS and are able to help Paul out.
He has asked a couple of questions and I haven't seen the answer
posted so I'm wondering about them.
1. You have different results than he does for the period of the
screen snap where you show individual trades. Have you figured out
if your calculations with TS are correct? i.e. computed a couple of days by hand to see if your tradestation results match your hand computations?
quote:
Originally posted by PaulR
Our numbers are different. Don't know why.
2. You mentioned look inside the bar. Are you only computing on
daily OHLC data? If you are using intraday data what time period are
you using (e.g 5 min bars)
Thanks.
Blue and PaulR,
My strategies needed a few adjustments (language that referred to incorrect ATR or wrong pft tgt etc) The code that I posted previously should be good. I am running the strategy on daily charts
(custom time frames on Intraday... for ex. 400 min Ty(ZN)starting at 8:20 and ending at 1700. ES 405 minute intraday chart starting at 0930 and ending at 1615. ESU09.D daily symbol seemed to give me incorrect open levels.
I do have 5 minute charts open for all products that I day trade.
I just like to have this strategy seperate.
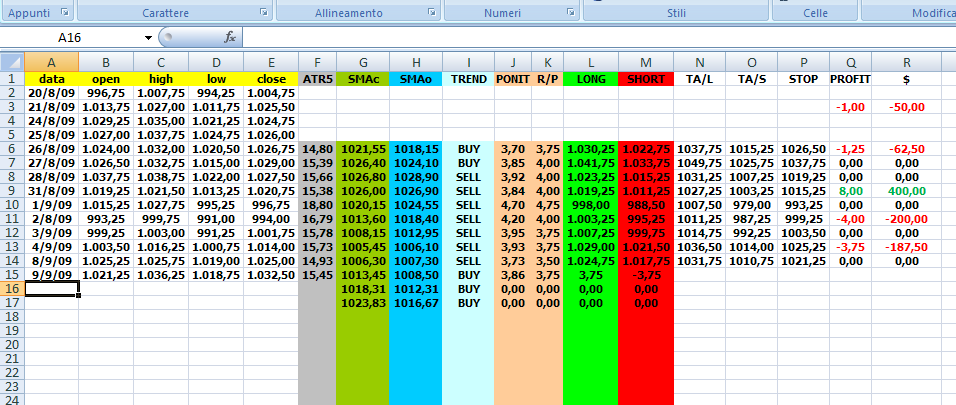
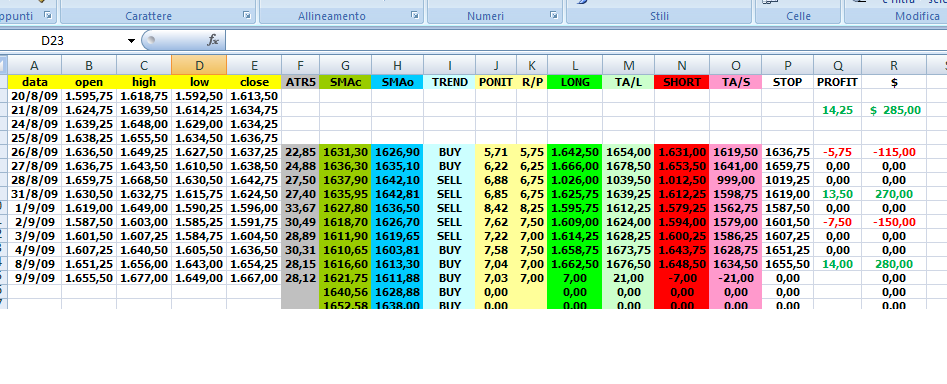
As far as going over calculations by hand... all the calculations seem correct.. major difference between Pauls calc and mine are the ATR #'s. ( I have included the 2 different ATR indicators on the chart. I can backtest any symbols with diferent variables pretty quickly . I will post the results when I have them. We can try to optimize the results also (by changing %'s etc. or adding variables such as pivot points etc). I want to make sure we are on the same page first. I'll try to upload some charts and results.
Paul ,are you using the ATR or the average daily range?
Do you use an indicator to compute these, or are you doing it by hand?
Thanks
John
PaulR,
Here is a strategy Performance report for TY(ZN) in excel format
John
Click link to access uploaded file:
TYU09__ATR_Strategy_Perf_Report.xls
TYU09__ATR_Strategy_Perf_Report.xls
jbux,
I am not sure if running the strategy on a 400 min. time frame is going to be the true results.
What if you are triggered into a trade, say 30 min. after the open and it pulls back to the open and you are stopped out. Then retraces back and shows a profit at the close of the day.
How does your strategy account for something like this?
Russ
quote:
Originally posted by PAUL9
that's OK daytrading, I just have to make a few more posts. But when I saw that RUSS had 9 I wondered, how many do you need?
hi,
you please check if my levels are correct?
Emini Day Trading /
Daily Notes /
Forecast /
Economic Events /
Search /
Terms and Conditions /
Disclaimer /
Books /
Online Books /
Site Map /
Contact /
Privacy Policy /
Links /
About /
Day Trading Forum /
Investment Calculators /
Pivot Point Calculator /
Market Profile Generator /
Fibonacci Calculator /
Mailing List /
Advertise Here /
Articles /
Financial Terms /
Brokers /
Software /
Holidays /
Stock Split Calendar /
Mortgage Calculator /
Donate
Copyright © 2004-2023, MyPivots. All rights reserved.
Copyright © 2004-2023, MyPivots. All rights reserved.


