Candle Pattern
To understand how I read candles you should read Steve Nison
Japanese CandleStick Charting Techniques / Beyond CandleSticks
Japanese CandleStick Charting Techniques / Beyond CandleSticks
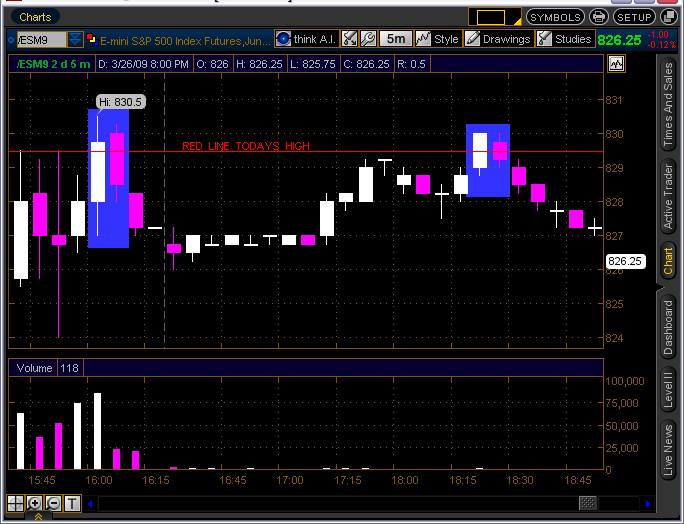
not trying to take over your thread here Red but look at the lowest range 15 minute bar from todays session.....very cool and thanks for pointing out that cool inside bar.....I don't know candles but there was a nice engulfing bar today near the post lunch highs.....that brought the market back to the low range bar
np Bruce;
About the inside bar you mentioned in the above chart.
Where it closed and when is two important factors for me.
Also before a candle pattern ever formes volume gives me
a hint something is getting ready to change
About the inside bar you mentioned in the above chart.
Where it closed and when is two important factors for me.
Also before a candle pattern ever formes volume gives me
a hint something is getting ready to change
that should say are* two important factors ^^... I need more coffee
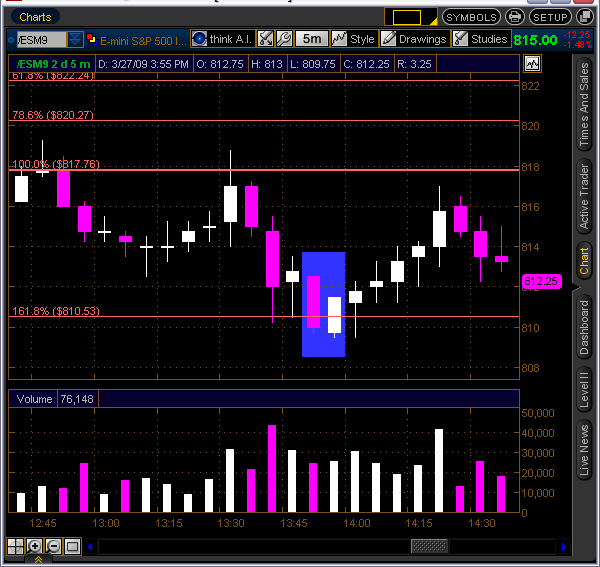
Same CandlePattern @ the 161.8% as the above chart
look close @ the volume in this area
Look to the left & right of the pattern I have marked you see two more
patterns. Find the s/r areas and watch for your patterns. There are many
more candle patterns. When you get into the beat of the market movement
you will begin to see more patterns. Most see the hammer, but when you learn
how to read the pattern I have marked you have a early clue. In the short
span shown there are about 4 or 5 trades....Here is a trading tip; FOCUS!!
I'am gone for awhile; great trading to you.
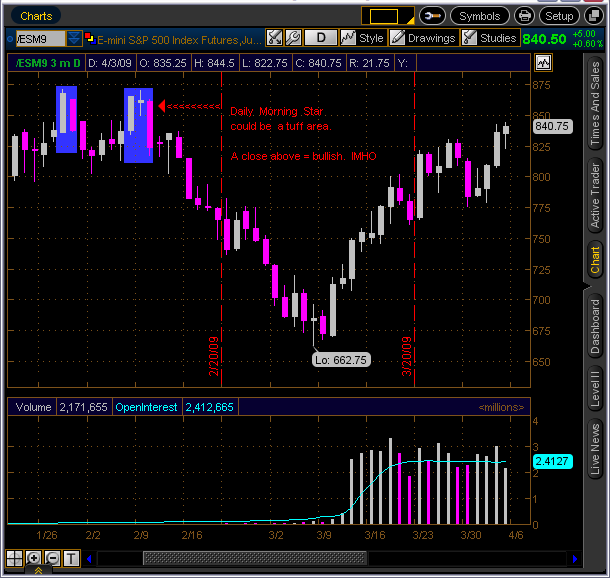
That should be "Daily Evening Star" in the chart above. COFFEE NEEDED!! :)
I don't trade with MAs ... but recently I started looking at them .. I have set up a quad chart with different time frame of MAs .. Today at 11:30am et. all four MAs came together and in fact price hit them about the same time .. I just got started with this so I'll post what I see from time to time .. looks good so far .. My intent is to use them as a confirming tool not a primary ...
Emini Day Trading /
Daily Notes /
Forecast /
Economic Events /
Search /
Terms and Conditions /
Disclaimer /
Books /
Online Books /
Site Map /
Contact /
Privacy Policy /
Links /
About /
Day Trading Forum /
Investment Calculators /
Pivot Point Calculator /
Market Profile Generator /
Fibonacci Calculator /
Mailing List /
Advertise Here /
Articles /
Financial Terms /
Brokers /
Software /
Holidays /
Stock Split Calendar /
Mortgage Calculator /
Donate
Copyright © 2004-2023, MyPivots. All rights reserved.
Copyright © 2004-2023, MyPivots. All rights reserved.


