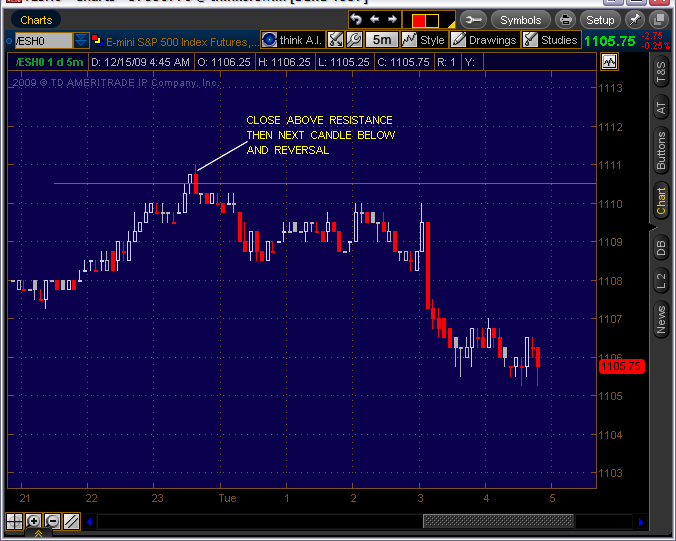
Candle Pattern
Thanks blue;
I didn't make clear and I should have. The 906.75 area is where I thought
the market might find a holding area from my prior projections until release of the fomc.
It should read "a key projection area"
I didn't make clear and I should have. The 906.75 area is where I thought
the market might find a holding area from my prior projections until release of the fomc.
It should read "a key projection area"
906.50 HOD....lol
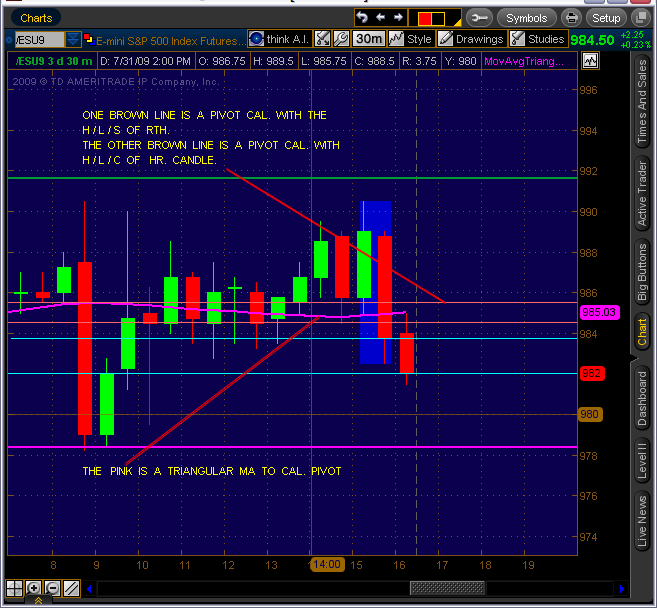
With many different types of pivots it is an issue with me to determin where a good PP is. So I look at three areas.
The PP areas shown in this chart are what I see for Monday 8/3/09
The PP areas shown in this chart are what I see for Monday 8/3/09
Candle Theory says the mid point of a dominate candle can be an s/r area. The daily candle
of 8/3 (mid point) is 991.75, as always I allow for stops which brought me to 990.25 for today 8/11.
of 8/3 (mid point) is 991.75, as always I allow for stops which brought me to 990.25 for today 8/11.
The daily candles of 8/4 - 8/5 are hanging man patterns meaning (bearish) the candle
pattern formed by the two candles of 8/6 - 8/7 form an engulfment (after an up trend
is called a "last engulf") that did not close strong above the hanging man pattern.
On 8/10 another hanging man. To confirm the bearish strength of the hanging man we need
a close below its real body which we got today. This is set to turn down unless some
news event changes the mind of the market
need to break the 985.75 and better yet close below to get a futher move
down...imho
down...imho
hi Rex
I put a candlestick question for you in trend and retracement thread
blue
I put a candlestick question for you in trend and retracement thread
blue
Today 9/17/09 1:45am ET
See the mid point of that 5min. candle act as resistance @ the 67.00 area then
move down to 1062. As I type we are moving back to that area. If we break thru
it should act as a support.
See the mid point of that 5min. candle act as resistance @ the 67.00 area then
move down to 1062. As I type we are moving back to that area. If we break thru
it should act as a support.
I received an e-mail from AmmoTrader that said they trade 10min. candles. I trade candle patterns not just the bar.
What is the advantage of the 10min. candles
Any input is much appreciated
What is the advantage of the 10min. candles
Any input is much appreciated
I don't trade with MAs ... but recently I started looking at them .. I have set up a quad chart with different time frame of MAs .. Today at 11:30am et. all four MAs came together and in fact price hit them about the same time .. I just got started with this so I'll post what I see from time to time .. looks good so far .. My intent is to use them as a confirming tool not a primary ...
Emini Day Trading /
Daily Notes /
Forecast /
Economic Events /
Search /
Terms and Conditions /
Disclaimer /
Books /
Online Books /
Site Map /
Contact /
Privacy Policy /
Links /
About /
Day Trading Forum /
Investment Calculators /
Pivot Point Calculator /
Market Profile Generator /
Fibonacci Calculator /
Mailing List /
Advertise Here /
Articles /
Financial Terms /
Brokers /
Software /
Holidays /
Stock Split Calendar /
Mortgage Calculator /
Donate
Copyright © 2004-2023, MyPivots. All rights reserved.
Copyright © 2004-2023, MyPivots. All rights reserved.

