ES 12-22-08
INTERESTING OPENING COMING UP!
1 off 72.50
kools tools:
5m 75, 79.75
15m 81.75
first number for 5m & 15 are from low candle
5m 75, 79.75
15m 81.75
first number for 5m & 15 are from low candle
quote:
Originally posted by VOwater
PT fwiw I could not duplicate your 500T charts you posted in 12-19 thread...they were simlar but certainly not exact...prolly why are fib numbers are different
Different data feeds: I running the raw CME feed directly through the Zen-Fire backbone connection at the CME server farm. Thus my tick data is unfiltered. It is my understanding TS runs the raw CME feed through a data packet algorithm at the TS data server before sending the packets out to subscribers. Thus, it is likely we will see a slightly different data stream which will give a different appearance on these tick charts.
Also, I noticed the NinjaTrader charting application is rounding off my fib projections to the nearest whole tick (.00 .25, .50, .75), TS is giving you the actual (not rounded) number from the raw calculation.
flat @ be
agreed pt
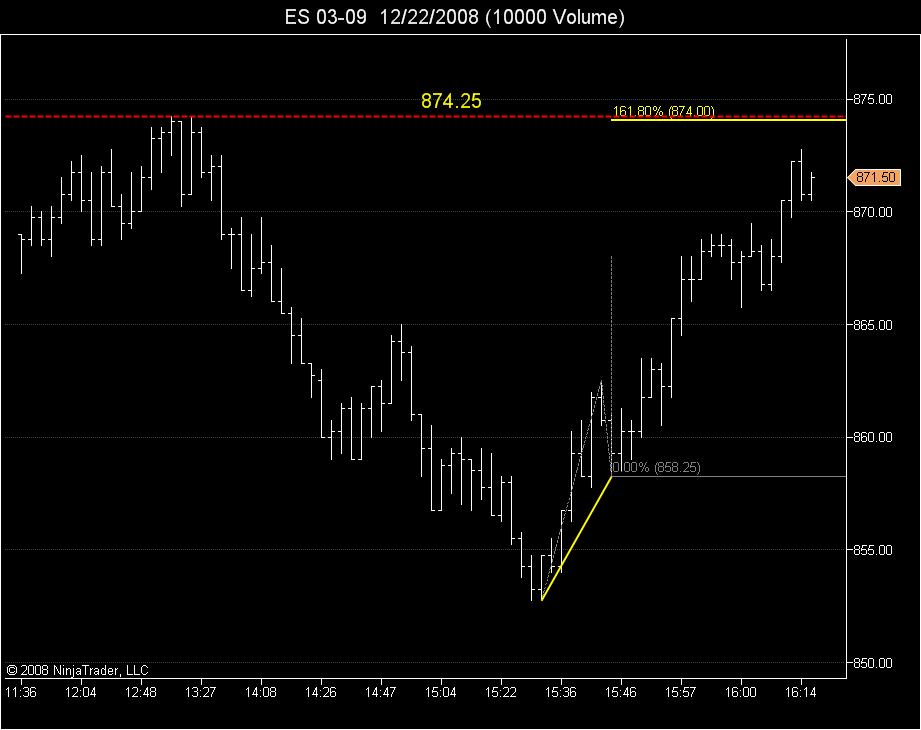
161.8% to the tick !
Thanks VO for projections
now the question becomes, if the market does not take out Margies 868.00 low set at 11:45am, does the 261.8% projection remain valid ?
as long as pivot L is not taken which i 68
PT see my response to bruce on 12-18 charts
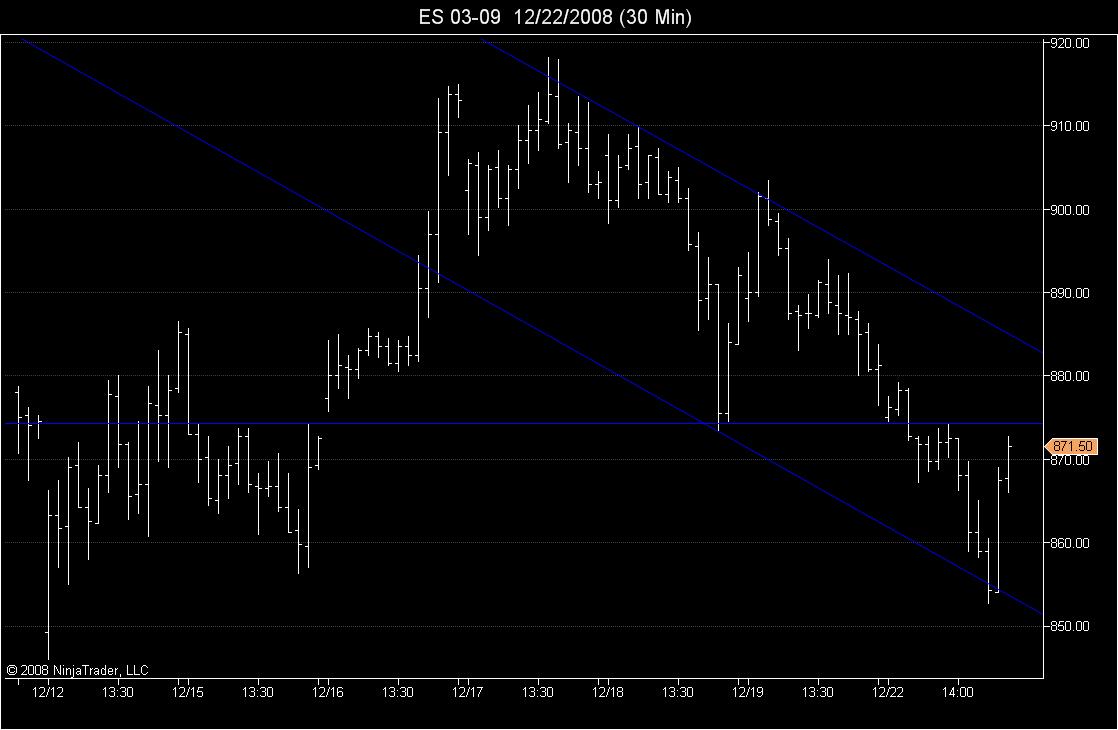
874.25 is the Horizontal line off the 30 minute chart.
Emini Day Trading /
Daily Notes /
Forecast /
Economic Events /
Search /
Terms and Conditions /
Disclaimer /
Books /
Online Books /
Site Map /
Contact /
Privacy Policy /
Links /
About /
Day Trading Forum /
Investment Calculators /
Pivot Point Calculator /
Market Profile Generator /
Fibonacci Calculator /
Mailing List /
Advertise Here /
Articles /
Financial Terms /
Brokers /
Software /
Holidays /
Stock Split Calendar /
Mortgage Calculator /
Donate
Copyright © 2004-2023, MyPivots. All rights reserved.
Copyright © 2004-2023, MyPivots. All rights reserved.

