ES 12-22-08
INTERESTING OPENING COMING UP!
quote:
Originally posted by Margie
quote:
Originally posted by prestwickdrive
Vo, Margie, pt or anyone, from the 11:12 L @ 73.75 to the 11:54 H @ 79.25 don't we get a projection to the 64.75 area unless 79.25 is taken out? TY - still trying to figure this out ...
pwd, I think you are referring to 10:12 ET to 10:54 ET, and this would not be a good projection because the movement is upwards and therefore would project a positive movement until the 73.75 was taken out and then becomes invalid but also this movement has a lot of "hesitation" so it would not be something we would use. I hope this helps.
Hi Margie:
Would the points you are referring to be valid 15 or 30 minute projections to the downside (to 962.50)?
Would the points you are referring to be valid 15 or 30 minute projections to the downside (to 962.50)?
Those bloody time zones catch us all at one time or another. :)
I always use CST because thats is mine and the CME's
buying first higher high close if pivot low isnt taken
quote:
Originally posted by VOwater
PT both my charting platforms show same numbers...what fib ratio do you use for 3rd target?
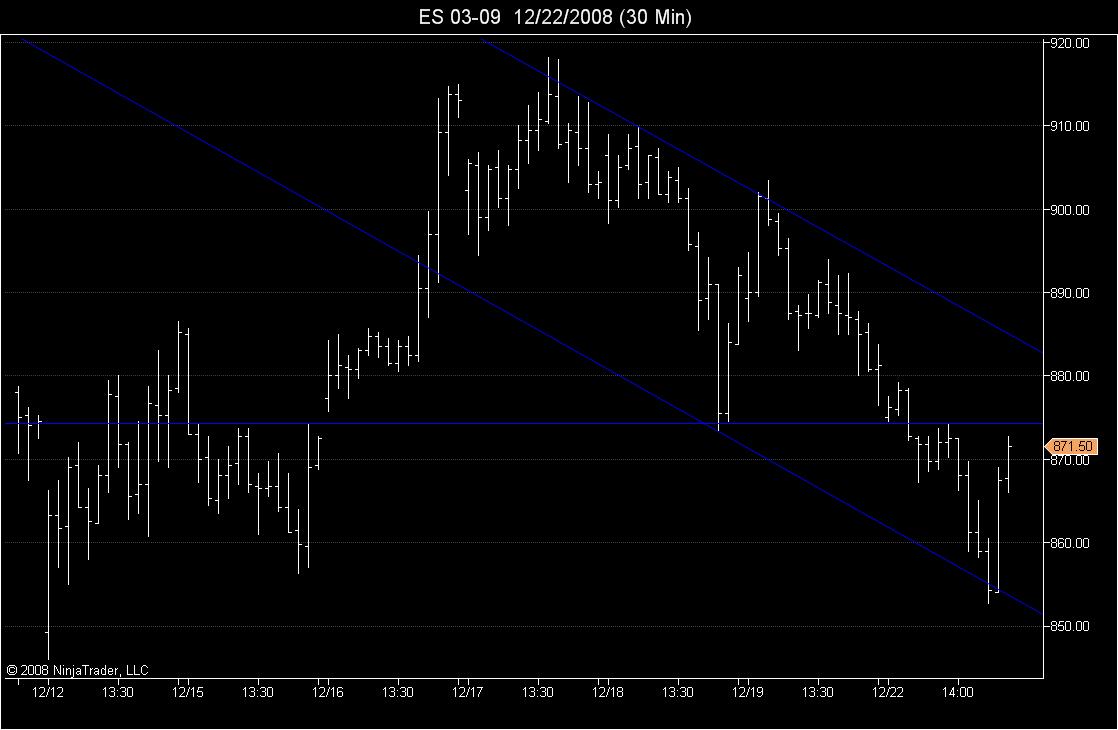
884.75 is a long term trendline going back to the 918.25 High set last week on Wednesday.
gotcha PT thanks
quote:
Originally posted by PDQ
Hi Margie:
Would the points you are referring to be valid 15 or 30 minute projections to the downside (to 962.50)?
If I was looking at the 15 minute chart I would start with the 10:45ET candle and the downward projection looks good until 12:00 ET, but kool starts with just the first candle of the projection and then adds the second and so on. If you used the first candle only you would get you to 890.00 if you use all the candles until noon it projects to 850.25, but everything is invalid if it hits 903.50 again. Maybe VO or Kool would answer this differently but thats how I see it but that's a longer term projection. I like the abc projections and the double tops and bottoms that start them off.
l @ 70.75...stop 68.25
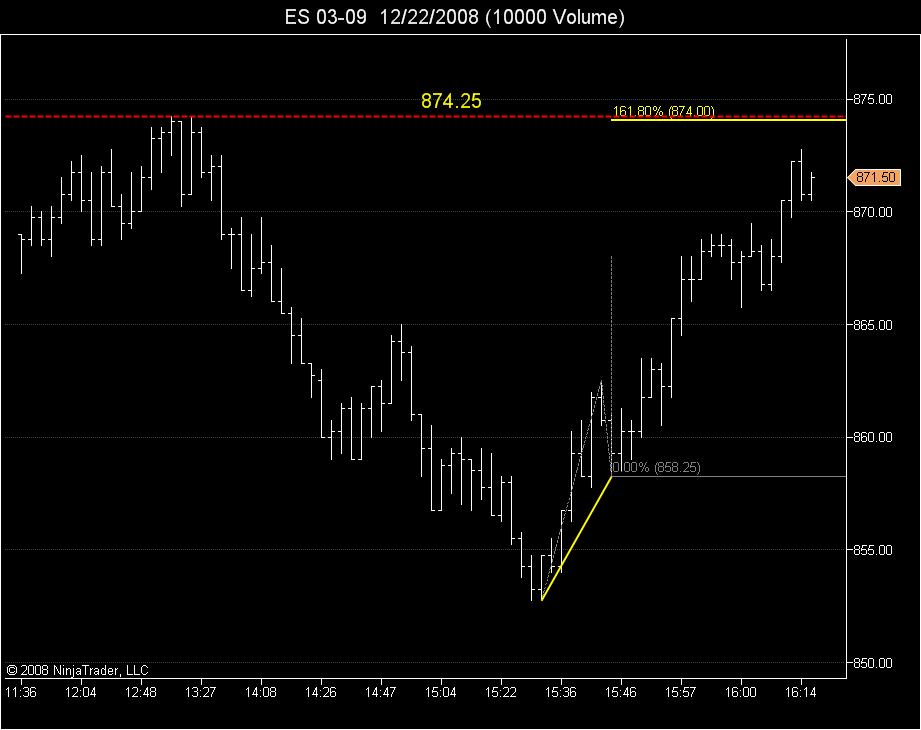
Thanks again Margie....Right now it looks like a 5 minute upside projection to 877.75?? (Which happens to be the 15 minute 20 period EMA)...
874.25 is the Horizontal line off the 30 minute chart.
Emini Day Trading /
Daily Notes /
Forecast /
Economic Events /
Search /
Terms and Conditions /
Disclaimer /
Books /
Online Books /
Site Map /
Contact /
Privacy Policy /
Links /
About /
Day Trading Forum /
Investment Calculators /
Pivot Point Calculator /
Market Profile Generator /
Fibonacci Calculator /
Mailing List /
Advertise Here /
Articles /
Financial Terms /
Brokers /
Software /
Holidays /
Stock Split Calendar /
Mortgage Calculator /
Donate
Copyright © 2004-2023, MyPivots. All rights reserved.
Copyright © 2004-2023, MyPivots. All rights reserved.

