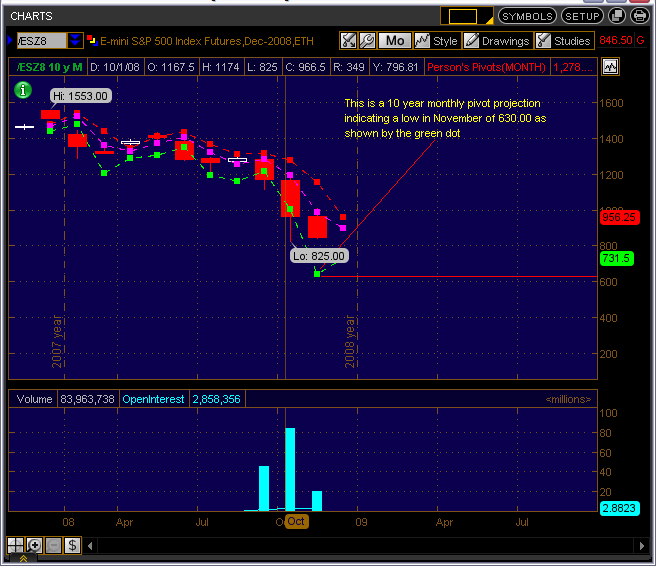
ES 11-12-08
my trigger was the bar that closed at 68.75 - a difference in the tick charts
we are in another ABC 1st is 80.25
entry was 72.75
Thanks for the help, Vo.
np...do you understand what I was trying to say...after reading it over I dont think I explained very well
wow...all those sellers at S1 kung fu'd us back to the other side of the range
we have been in a 12 pt range for 3 hrs
Yes, I understand after I looked at the charts closely, but I do not know how you get your 1st, 2nd, and 3rd targets on the final leg.
you gots to put a fibonacci on it...in your tools you have a fibo trend based price extension lines tool. click on A then on B and then C and it will put them in automatically
Perfect, thx
Emini Day Trading /
Daily Notes /
Forecast /
Economic Events /
Search /
Terms and Conditions /
Disclaimer /
Books /
Online Books /
Site Map /
Contact /
Privacy Policy /
Links /
About /
Day Trading Forum /
Investment Calculators /
Pivot Point Calculator /
Market Profile Generator /
Fibonacci Calculator /
Mailing List /
Advertise Here /
Articles /
Financial Terms /
Brokers /
Software /
Holidays /
Stock Split Calendar /
Mortgage Calculator /
Donate
Copyright © 2004-2023, MyPivots. All rights reserved.
Copyright © 2004-2023, MyPivots. All rights reserved.
