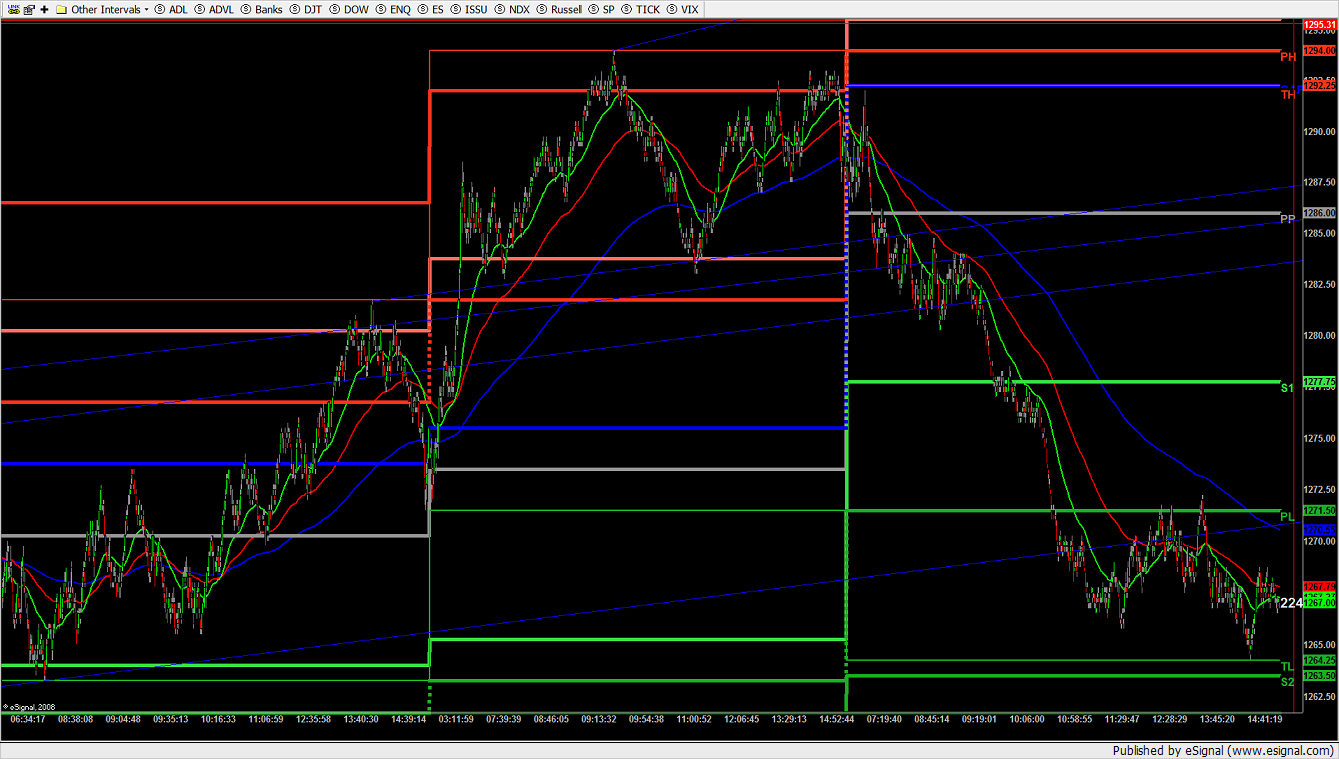
ES 8-25-08
The measured move is surpassed without making a higher high and has fulfilled three descending premium prices from 94. I've a day limit at price short at the open targeting 80 even for 12.25 points, using a 4 point stop.
The false bull was a B wave pullup in a bear controlled double zig-zag ABC whose measured move would come in at 1220.25, breaching the bull's second wave, where bears were satisfied at 1231.50. It's too early to tell if a bounce from 20 will be a bonifide 3rd wave of the bull or a failed attempt leading to new bear market lows. I strongly suspect bull head-fakes all the way down from here to a double bottom at 1200.75 and then a bear exahustion move until it irons out to create a bottom. It's been one hell of a bull run. I'm targeting 1140 when I decide to get longer-term. I want to see what the bull bounce does however.
First thing's first though; bears have to hold 80 even.
I've seen a reversal from something this gnarly before, but never suspended in the midst of action. I wouldn't hold that long, Joe. Every bull channel is toast.
Anytime the ES runs up 4points that quick I take it and get out. But I can hold a short for a lot longer??? LOL...I was going to hold it overnight till I saw the dow below 11400
The thing that gets me is the extream low volume today. 1.38mill RTH thats the lowest its been all summer.
quote:
Originally posted by CharterJoe
Newkid,
That post is a weekly profile. I am now running a monthly profile starting with the first trading day of the month to the last, I am also running a weekly MP and monitoring the DVA's not the past VAH or VAL, but the DVA of the month. Friday the markets almost hit the VAH on the monthly and now almost back at the DVAL on the monthly. I have also back tested and found that the first two days of the week should be ran with the previous weeks VA and the fisrt week of the month should be used with the last months VA.
This is what I have found works very good...
Monthly mp = IB 1 week
Weekly mp = 2 day IB
daily mp = 60 min IB
I have also noticed that monlthy MPs behave just as daily. Aug is a buy low sell high with rising value, but july was the opposite, while june was a down trend patteren constintly having range extensions on the monthly chart.
So you will run your weekly MP after market close today correct
yes
Thanks Joe
Emini Day Trading /
Daily Notes /
Forecast /
Economic Events /
Search /
Terms and Conditions /
Disclaimer /
Books /
Online Books /
Site Map /
Contact /
Privacy Policy /
Links /
About /
Day Trading Forum /
Investment Calculators /
Pivot Point Calculator /
Market Profile Generator /
Fibonacci Calculator /
Mailing List /
Advertise Here /
Articles /
Financial Terms /
Brokers /
Software /
Holidays /
Stock Split Calendar /
Mortgage Calculator /
Donate
Copyright © 2004-2023, MyPivots. All rights reserved.
Copyright © 2004-2023, MyPivots. All rights reserved.
