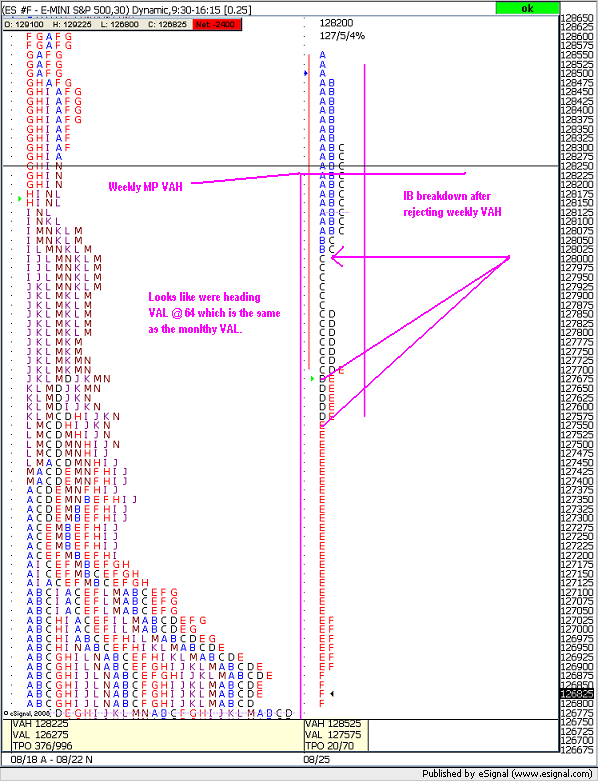
ES 8-25-08
The measured move is surpassed without making a higher high and has fulfilled three descending premium prices from 94. I've a day limit at price short at the open targeting 80 even for 12.25 points, using a 4 point stop.
The false bull was a B wave pullup in a bear controlled double zig-zag ABC whose measured move would come in at 1220.25, breaching the bull's second wave, where bears were satisfied at 1231.50. It's too early to tell if a bounce from 20 will be a bonifide 3rd wave of the bull or a failed attempt leading to new bear market lows. I strongly suspect bull head-fakes all the way down from here to a double bottom at 1200.75 and then a bear exahustion move until it irons out to create a bottom. It's been one hell of a bull run. I'm targeting 1140 when I decide to get longer-term. I want to see what the bull bounce does however.
First thing's first though; bears have to hold 80 even.
Covering at 75.50 for 7 3/4 handles. I have some errands to run. You all keep and make some money now. See you tomorrow.
buying 1270.25,4 point stop
sneak attack @ 72.50
Almost hit 64, that was too much to fast I bailed out of the short @ 71. Still targeting Monthly DVAL @ 64ish....Bruce did you take a look at those longer term MP thread I posted?
I love monthly market profile, it is literaly the best thing I have ever seen, and I have seen alot.
bought another 1268.25, avg. now 1269.25. holding 2....
I have a fibo @ 63.00
CharterJoe,
Is this an MP chart for a month's data? Is it a rolling month? What are the dates for it?
Is this an MP chart for a month's data? Is it a rolling month? What are the dates for it?
THANKS GUYS , I BAILED AT 1269.00 FOR A BREAK EVEN TRADE. ILL TRY AGAIN AROUND 64
Thanks Joe
Emini Day Trading /
Daily Notes /
Forecast /
Economic Events /
Search /
Terms and Conditions /
Disclaimer /
Books /
Online Books /
Site Map /
Contact /
Privacy Policy /
Links /
About /
Day Trading Forum /
Investment Calculators /
Pivot Point Calculator /
Market Profile Generator /
Fibonacci Calculator /
Mailing List /
Advertise Here /
Articles /
Financial Terms /
Brokers /
Software /
Holidays /
Stock Split Calendar /
Mortgage Calculator /
Donate
Copyright © 2004-2023, MyPivots. All rights reserved.
Copyright © 2004-2023, MyPivots. All rights reserved.
