Flash Crash
Search Dictionary
Definition of 'Flash Crash'
A Flash Crash is a sudden and large drop in the price of a stock, future, currency or any security which then recovers within a very short time period. The term Flash Crash comes from the term flash flood which is a flood that lasts for a brief period of time.
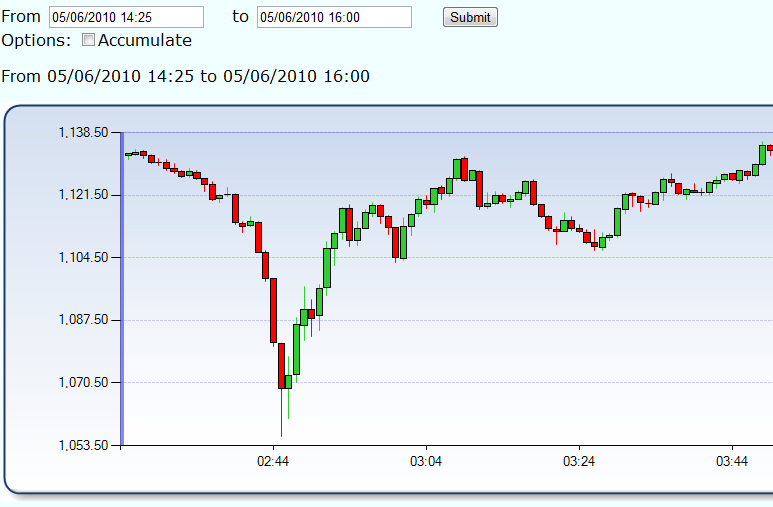
On 6 May 2010 at 2:45pm EDT there was a Flash Crash in the United States stock market in which the Dow Jones Industrial Average plummeted about 1,000 points (around nine percent: 9%) and then recovered back to its original level within minutes. It was the second largest point swing, (1,010.14 points) and the biggest one-day point decline (998.5 points) on an intraday basis in Dow Jones Industrial Average (DJIA) history.
An investigation by the SEC and CFTC released on September 30, 2010 under the titled "Findings Regarding the Market Events of May 6, 2010" determined: At 2:32 p.m. (EDT), against a "backdrop of unusually high volatility and thinning liquidity" that day, "a large fundamental trader (a mutual fund complex) initiated a sell program to sell a total of 75,000 E-Mini S&P 500 contracts (valued at approximately $4.1 billion) as a hedge to an existing equity position." The report says that this was an unusually large position and that the computer algorithm the trader used to trade the position was set to "target an execution rate set to 9% of the trading volume calculated over the previous minute, but without regard to price or time.
Below is a 1 minute candle stick chart showing what happened during the flash crash. Times are United States Eastern EST.
Do you have a trading or investing definition for our dictionary? Click the Create Definition link to add your own definition. You will earn 150 bonus reputation points for each definition that is accepted.
Is this definition wrong? Let us know by posting to the forum and we will correct it.
Emini Day Trading /
Daily Notes /
Forecast /
Economic Events /
Search /
Terms and Conditions /
Disclaimer /
Books /
Online Books /
Site Map /
Contact /
Privacy Policy /
Links /
About /
Day Trading Forum /
Investment Calculators /
Pivot Point Calculator /
Market Profile Generator /
Fibonacci Calculator /
Mailing List /
Advertise Here /
Articles /
Financial Terms /
Brokers /
Software /
Holidays /
Stock Split Calendar /
Mortgage Calculator /
Donate
Copyright © 2004-2023, MyPivots. All rights reserved.
Copyright © 2004-2023, MyPivots. All rights reserved.
