Polynomial Regression Channel (PRC) Bands
Search Dictionary
Definition of 'Polynomial Regression Channel (PRC) Bands'
PRC stands for Polynomial Regression Channel. This is a regression indicator that is used on charts.
A linear regression indicator draws a straight line of best fit on a chart. The PRC indicator applies a polynomial function to the linear regression function to adapt itself to the flow of market prices. Since they are regression bands that self adjust for volatility.
Do you use Ninja Trader? If so then you can download the indicator for Ninja Trader here:
Do you have a question about how to use this indicator? If so, we have a topic in the forum dedicated to this indicator: Polynomial Regression Channel Discussion.
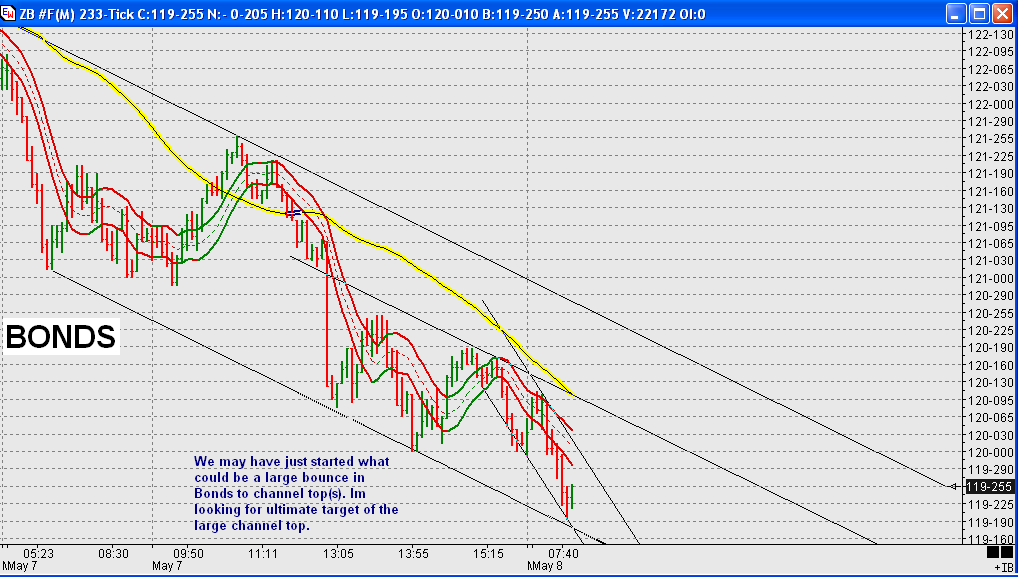
Here is a chart that was posted in our forum by trader koolblue who is an avid user of the PRC Bands:

This indicator is used to fade the direction of the market. The basic trading strategy is to buy when the price enters the lower band region or sell when the price hits the upper band. Traders will take profits at the middle band but an aggressive trader might hold out and expect the market to hit the other band.
If you are an eSignal user and want us to create this indicator for you for eSignal then contact us and let us know.
A linear regression indicator draws a straight line of best fit on a chart. The PRC indicator applies a polynomial function to the linear regression function to adapt itself to the flow of market prices. Since they are regression bands that self adjust for volatility.
Do you use Ninja Trader? If so then you can download the indicator for Ninja Trader here:
Click link to access uploaded file:
PRC2.zip
PRC2.zip
Do you have a question about how to use this indicator? If so, we have a topic in the forum dedicated to this indicator: Polynomial Regression Channel Discussion.
Here is a chart that was posted in our forum by trader koolblue who is an avid user of the PRC Bands:

This indicator is used to fade the direction of the market. The basic trading strategy is to buy when the price enters the lower band region or sell when the price hits the upper band. Traders will take profits at the middle band but an aggressive trader might hold out and expect the market to hit the other band.
If you are an eSignal user and want us to create this indicator for you for eSignal then contact us and let us know.
Do you have a trading or investing definition for our dictionary? Click the Create Definition link to add your own definition. You will earn 150 bonus reputation points for each definition that is accepted.
Is this definition wrong? Let us know by posting to the forum and we will correct it.
Emini Day Trading /
Daily Notes /
Forecast /
Economic Events /
Search /
Terms and Conditions /
Disclaimer /
Books /
Online Books /
Site Map /
Contact /
Privacy Policy /
Links /
About /
Day Trading Forum /
Investment Calculators /
Pivot Point Calculator /
Market Profile Generator /
Fibonacci Calculator /
Mailing List /
Advertise Here /
Articles /
Financial Terms /
Brokers /
Software /
Holidays /
Stock Split Calendar /
Mortgage Calculator /
Donate
Copyright © 2004-2023, MyPivots. All rights reserved.
Copyright © 2004-2023, MyPivots. All rights reserved.