ES 10-13-22
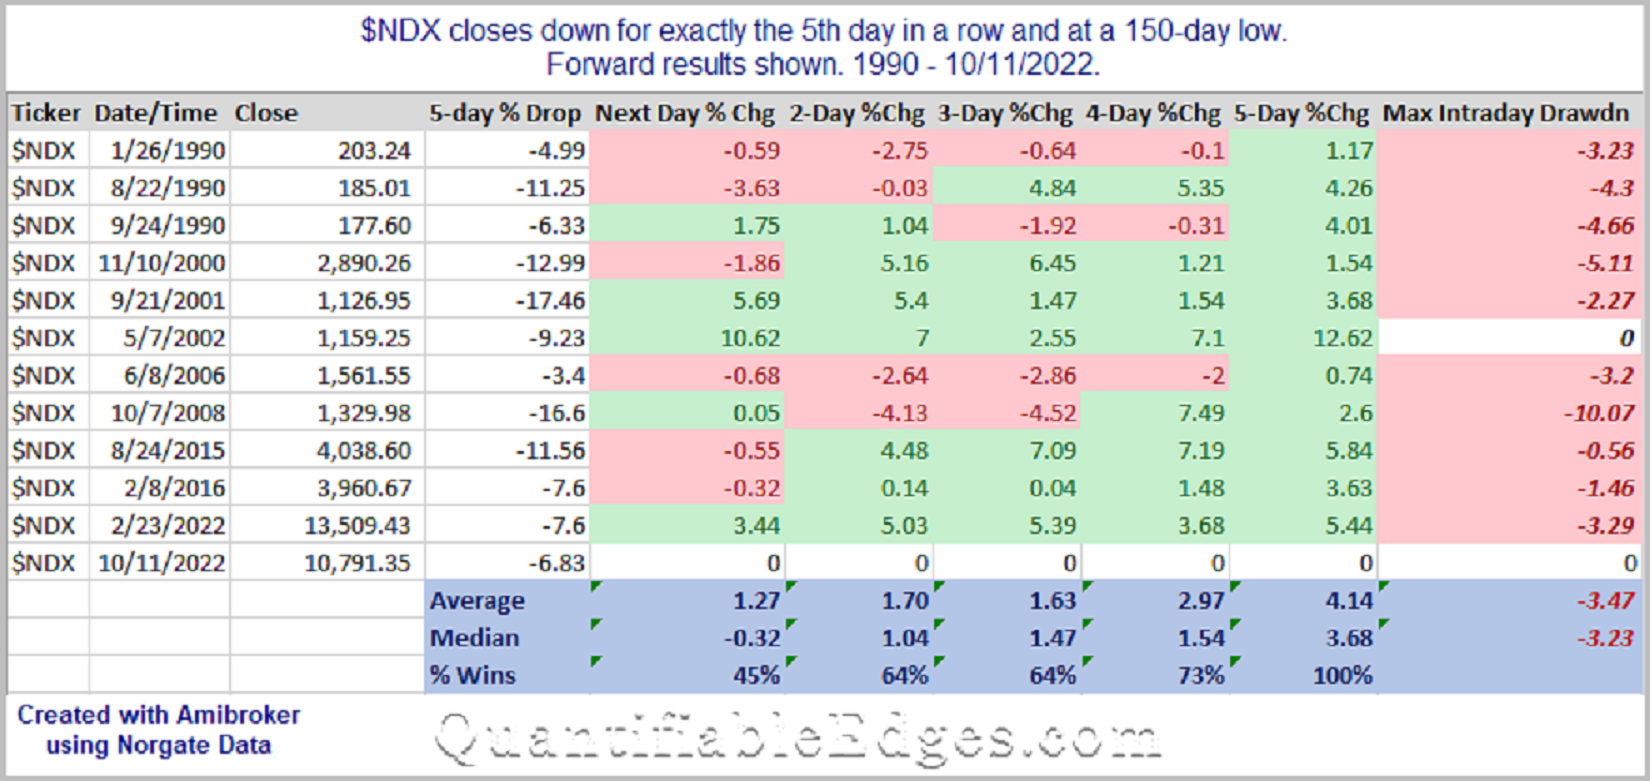
$NDX Performance After 5 Down Days and a 150-Day Low
Posted on October 12, 2022 by Rob Hanna
The two big up days to start last week have now been followed by 5 down days in a row. And the 5-day selloff has put the NDX at a new bear-market closing low. The study below looks at other times since 1990 that NDX closed down for the 5th consecutive day and at a 150-day low.
These results suggest an upside tendency. Five days later all 11 instances closed higher, with the average instance up 4.14% and the median up 3.68%. But it is also notable that the gains were not achieved without some short-term pain. The average drawdown of the 11 instances was nearly 3.5%.
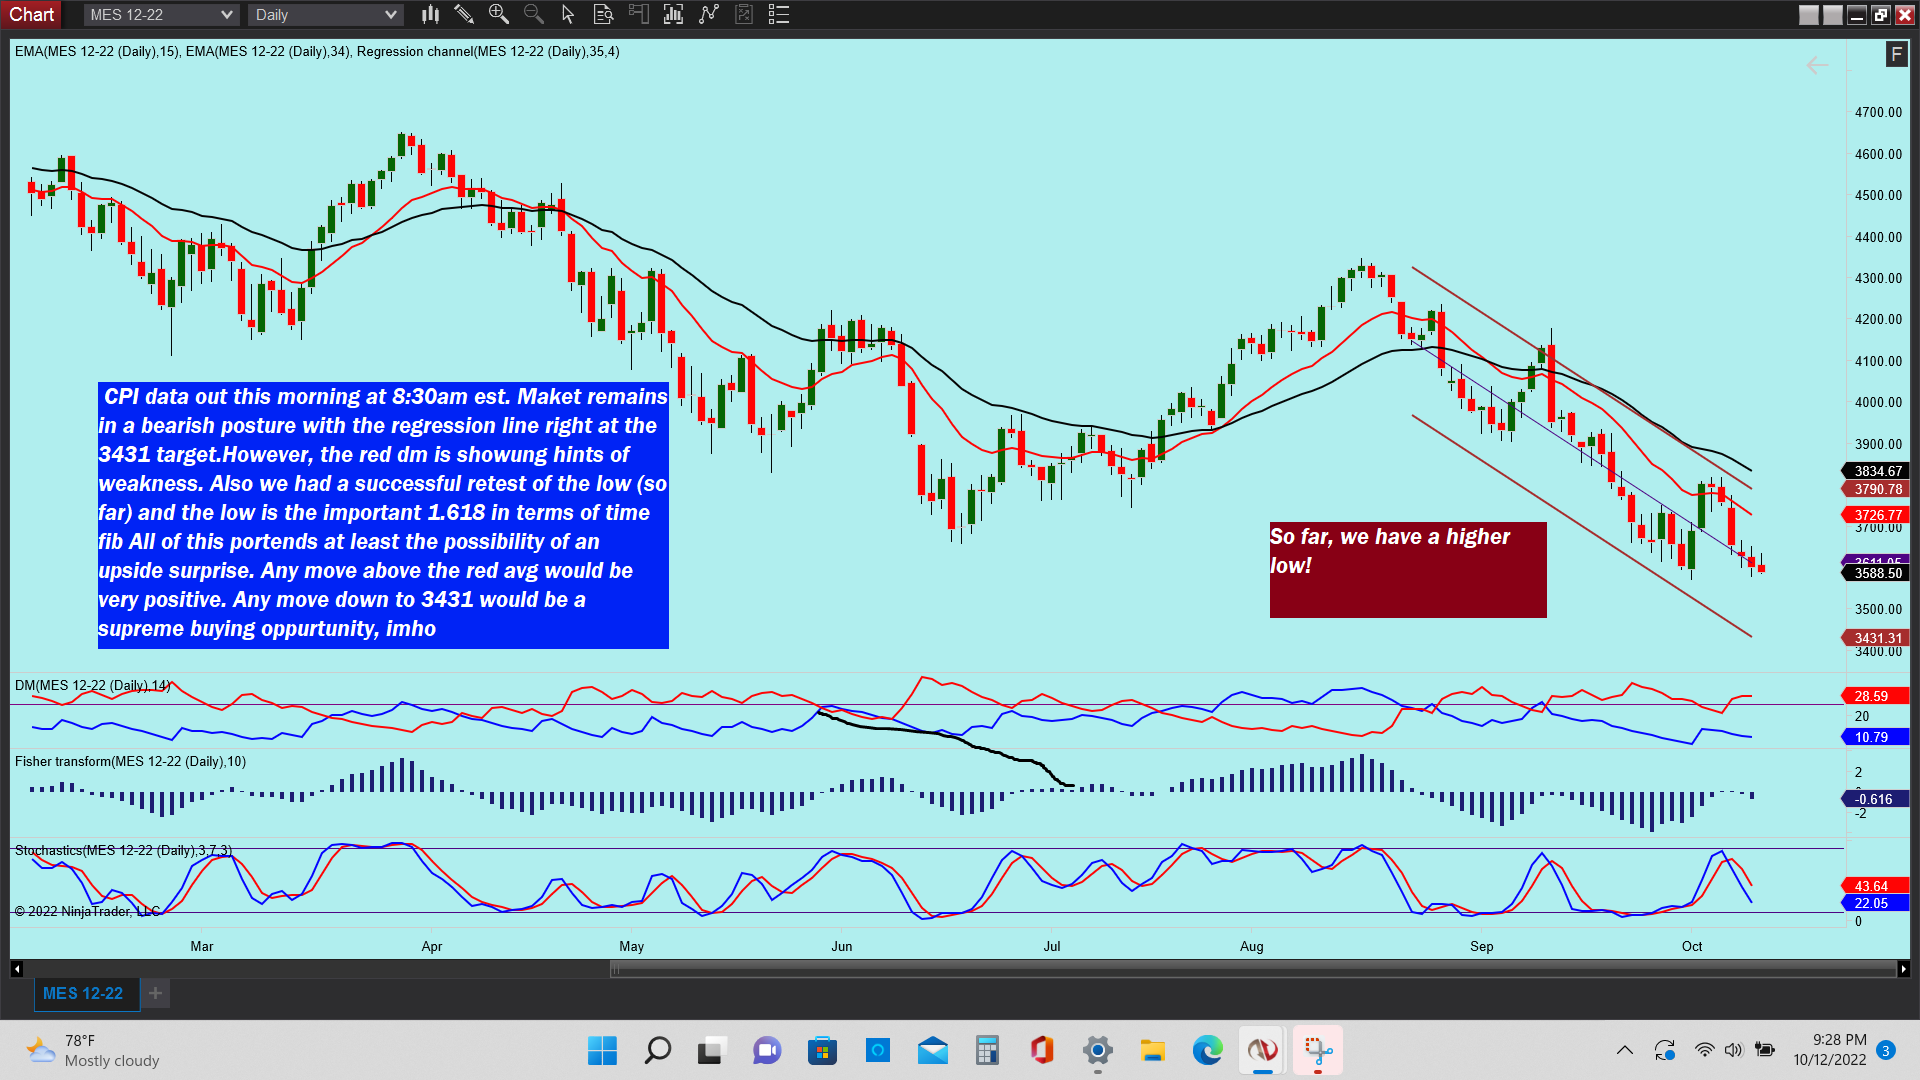
Nice move developing, and i got a good piece of it. All charts now positive ahead of the all important data release . Yesterday was a very small range day ( a compression) giving odds of a large move today. avg daily range is 80, but i would expect a large expansion of that range.This is gonna be fun!
This is interesting! 8.3 increase in yoy but below Juys 8.5
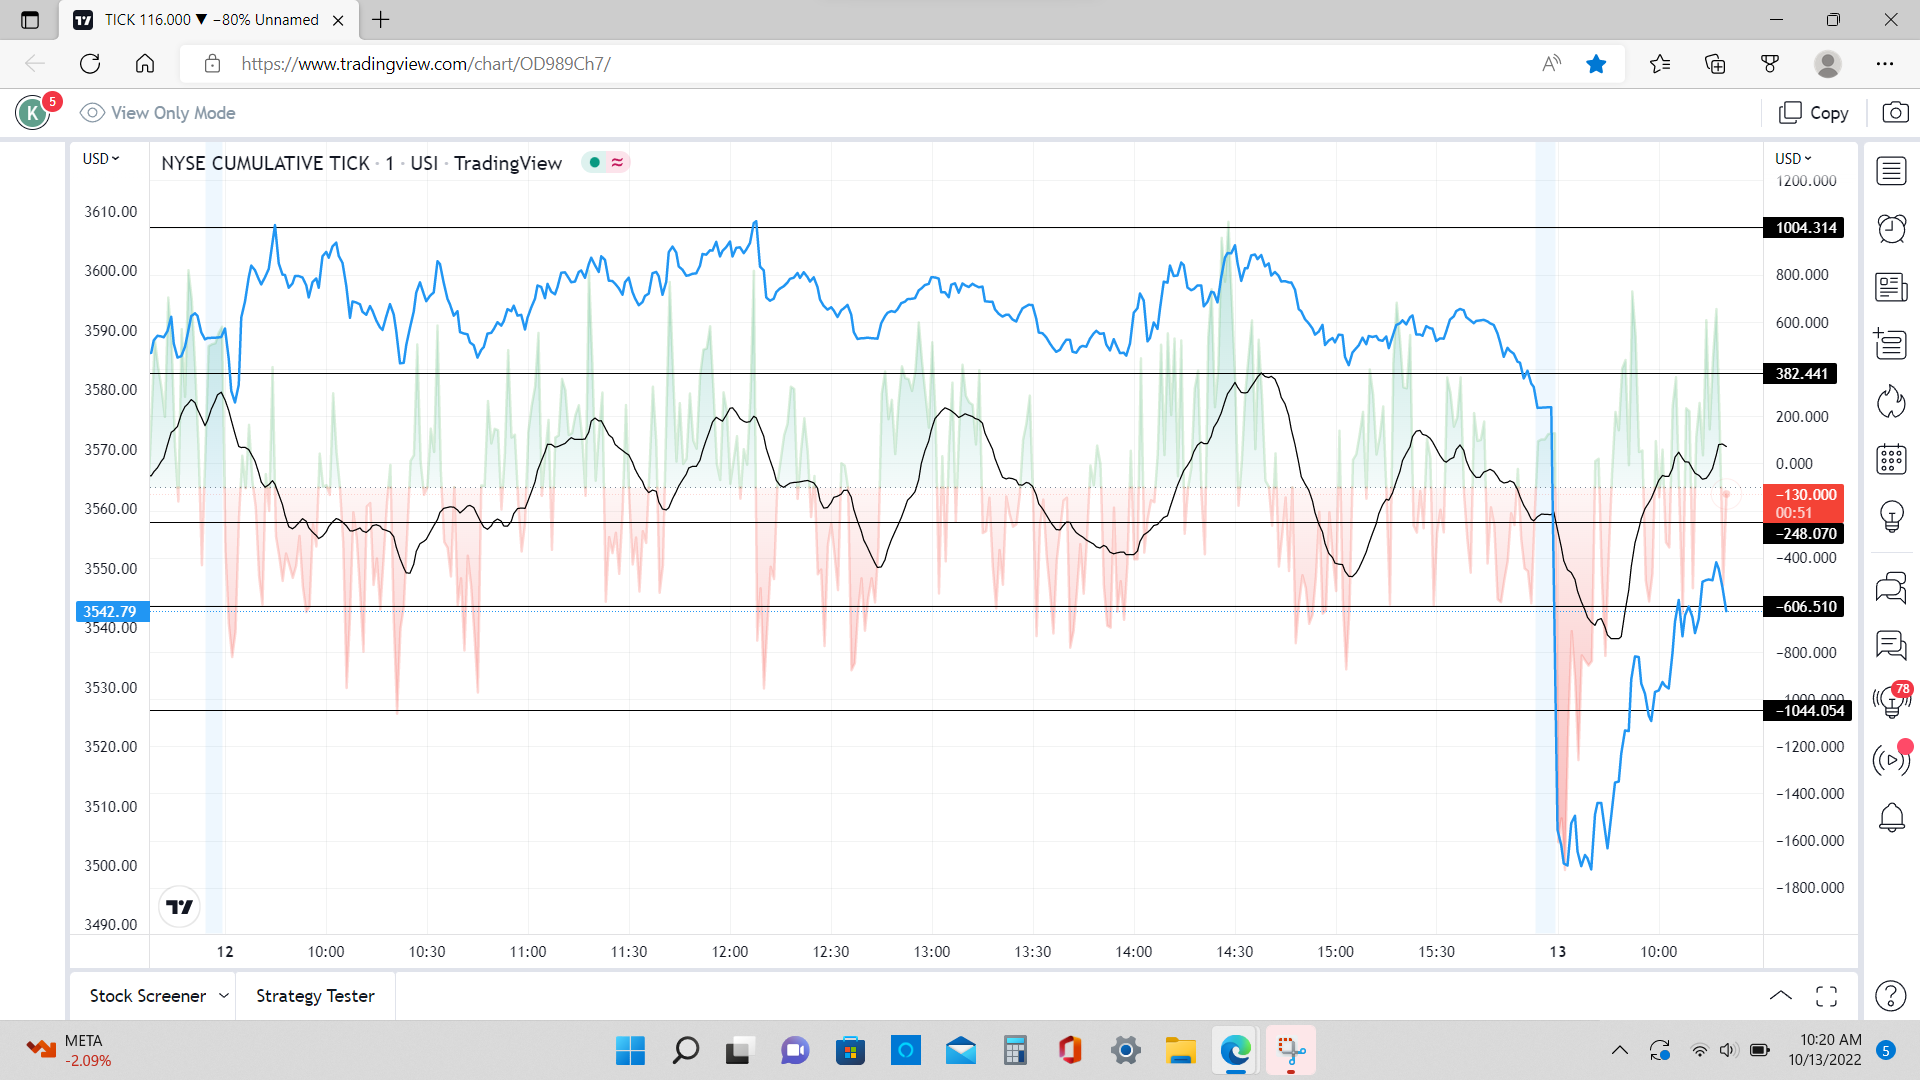
Sorry! No crash today boys! the black avg of cumulative ticks went past -600 where it loves to turn around , but turned north after -800 instead of south of 1000 (a crash zone) . recovered to minus 200 as i type.This might imply ,that most (but probably not all ) of the decline is past.
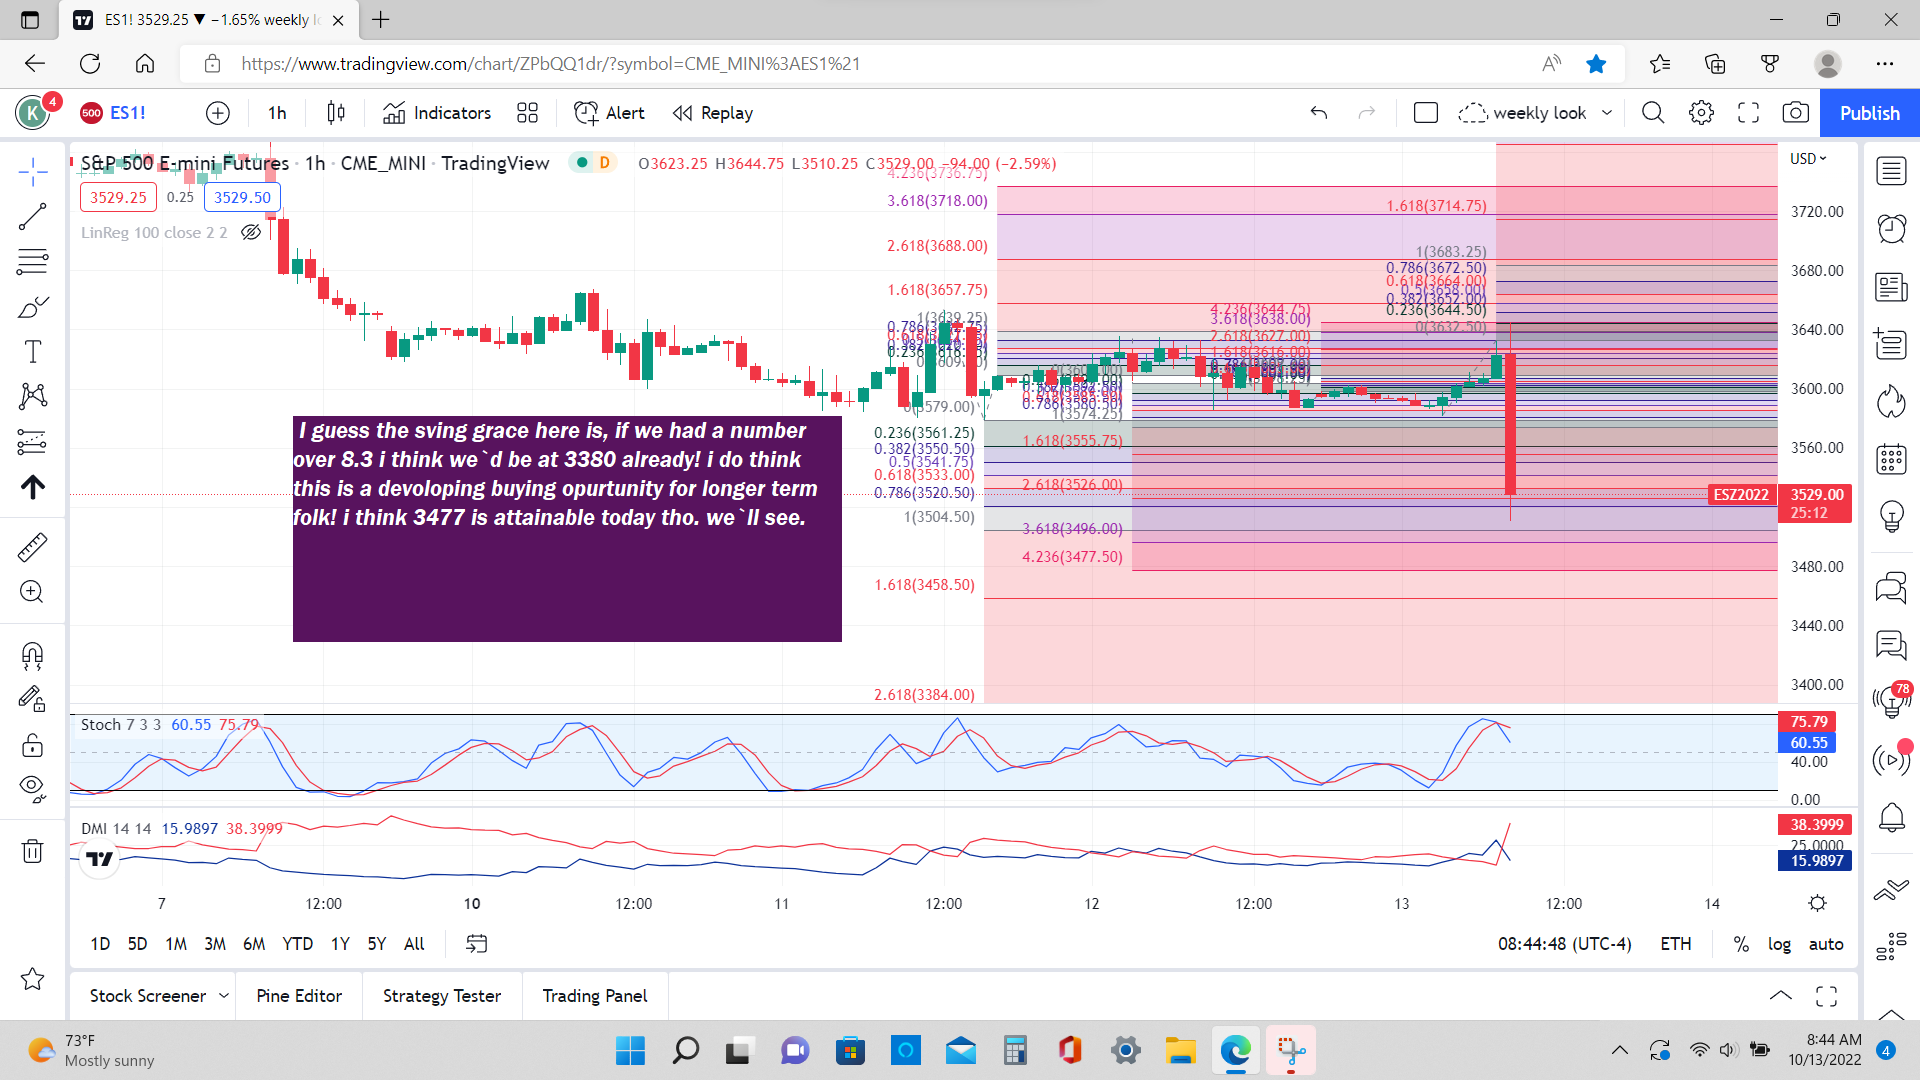
selling 3555
short 2 from 3555. Ticks are supportive with the black avg above zero. It loves to turn here tho, so dont get too bullish yet.
Going to exit at 3637 if they let me
welli never got my 3537 exit, had to bail at 3546 for 9 points each. It missed me by one point.. IM surprised we didnt get a better retest of the 3491 low....but que sera! Watching for a good long entry
As crazy as it sounds, like i stated, yhis could be a huge buying oppurtunity. We have already travelled 120 points up from the low! Thats what intermediate term bottoms look like! Time will tell, but thats what it looks like to me.
wow, happened while i was posting! Cya!
Emini Day Trading /
Daily Notes /
Forecast /
Economic Events /
Search /
Terms and Conditions /
Disclaimer /
Books /
Online Books /
Site Map /
Contact /
Privacy Policy /
Links /
About /
Day Trading Forum /
Investment Calculators /
Pivot Point Calculator /
Market Profile Generator /
Fibonacci Calculator /
Mailing List /
Advertise Here /
Articles /
Financial Terms /
Brokers /
Software /
Holidays /
Stock Split Calendar /
Mortgage Calculator /
Donate
Copyright © 2004-2023, MyPivots. All rights reserved.
Copyright © 2004-2023, MyPivots. All rights reserved.


