MP Spoos April 7
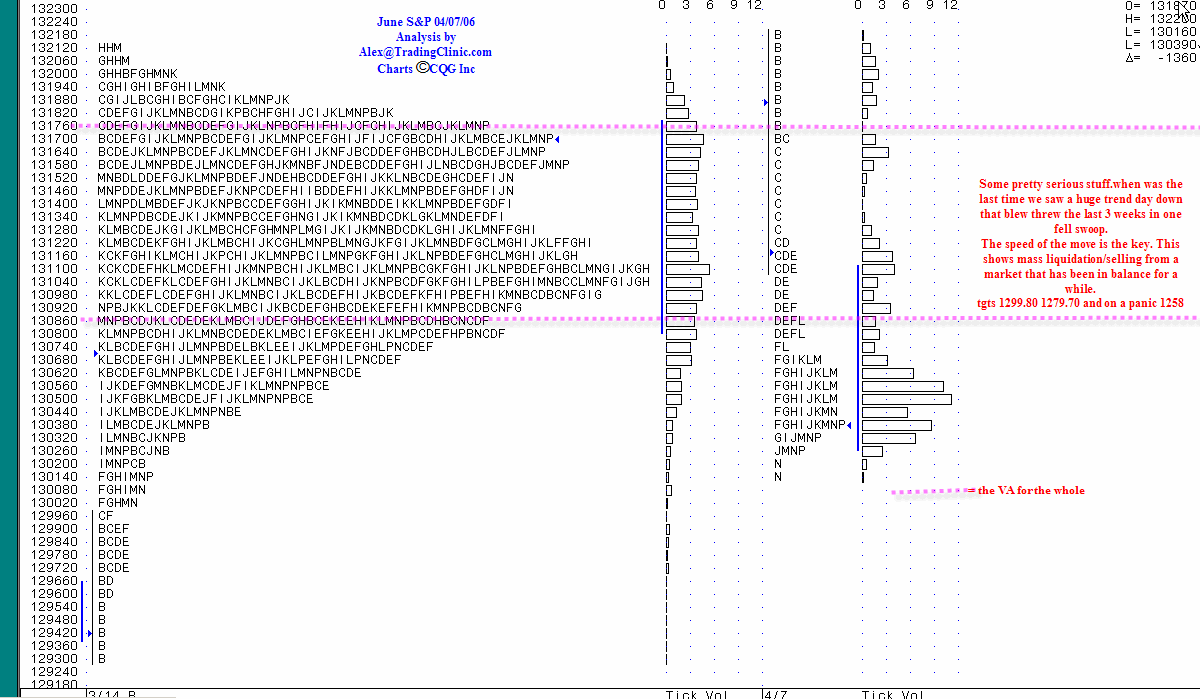
I think that the question should be: When was the last time that we saw such a tight 3 week range? Blowing through a tight 3 week range like that is not difficult when it is so tight. What was Friday's range? Just over 20 points? That's double the average range but not unusual as we've seen these types of days before and on average we should expect at least one 20 point day each month. So after 3 weeks of tight range we are approaching our expectation of a 20 point range day and so this is not unexpected.
I think that what was unexpected was the fact that the ES/SP/S&P500 made a new High of Year (and of many months prior to that) before it collapsed by 20 points.
I think that what was unexpected was the fact that the ES/SP/S&P500 made a new High of Year (and of many months prior to that) before it collapsed by 20 points.
unexpected. sorry but it was actually considered as being a strong possibility. I did not post the chart here but it is posted on my website
quote:
Originally posted by alleyb
unexpected. sorry but it was actually considered as being a strong possibility.
What was considered a strong possibility? (1) Making a new high, (2) Collapsing by 20 points, (3) Both of the above.
I agree that making a new high was a strong possibility irrespective of other market conditions because that would be a statistically high probability because of its proximitiy to the high. What I am talking about is the combination of the two.
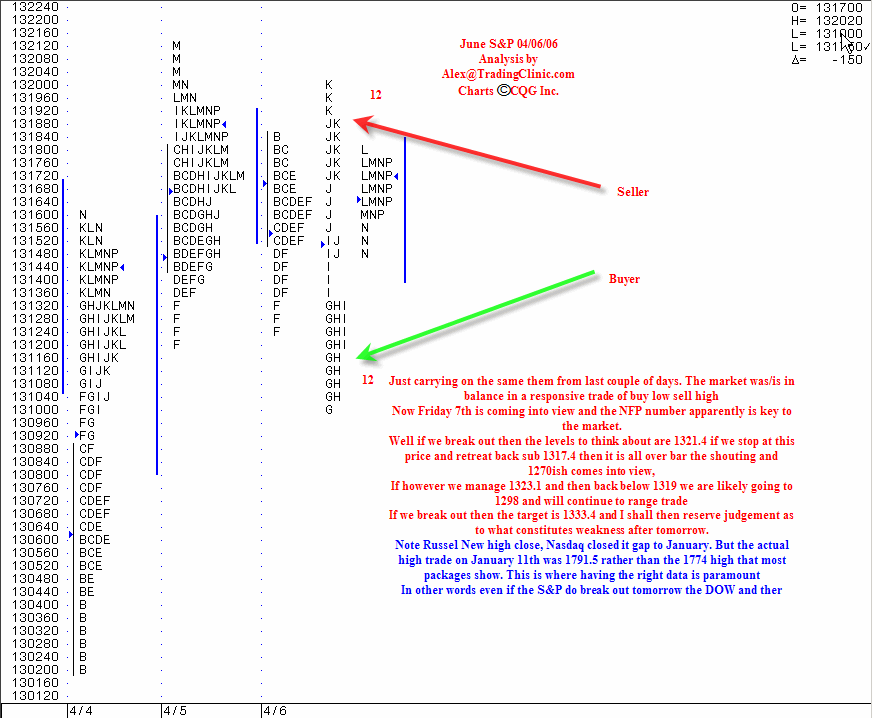
then read the comments i posted on the chart and I rest my case. Don't think I could have been much clearer and well in advance to boot
They're too ambiguous alleyb. I still can't work out the answer to my question by reading your comments.
so which part is too ambiguous. It says ............If we break out then the levels to think about are 1321.4 If we stop at this price and retreat back sub 1317.4 then it is all over bar the shouting and 1270ish comes into view. If however we manage 1323.1 and then back below 1319 we are likely going to 1298 and will continue to range trade. If we break out then the target is 1333.4.................... What could be not clear. you were given precise levels and instructions. let me make it simpler. IF 1321.4 trades and then it fails to hold the new high > 1321.5 and retreats breaking 1317.4 then 1270 is the target. If we get to 1323.1 and then fail to hold the new highs and break back below 1319 then 1298.. Only on a clear break and maintain then 1333.4 would have been the target upside.
Again I ask what do you not understand. I post bonds and Spoos regularly here with clear levels. I challenge you to show me anyone else in the world doing the same in advance with the consistency that I show of not just hitting the levels but nailing home runs in both Bonds and stocks Indices.
These charts and comments are offered in this forum freely in advance and all I can say is that maybe if you find it ambiguous then you would gain benefit from taking my MP Courses.
What I was speaking about was your referal to strong probability - I couldn't find where you'd indicated that there was a strong probability of that happening.
quote:
Originally posted by alleyb
...These charts and comments are offered in this forum freely in advance and all I can say is that maybe if you find it ambiguous then you would gain benefit from taking my MP Courses.
I did ask about your course before at the end of this topic: MP Spoos Feb 8th
I have answered extensively via the link that you posted re the MP courses.
Emini Day Trading /
Daily Notes /
Forecast /
Economic Events /
Search /
Terms and Conditions /
Disclaimer /
Books /
Online Books /
Site Map /
Contact /
Privacy Policy /
Links /
About /
Day Trading Forum /
Investment Calculators /
Pivot Point Calculator /
Market Profile Generator /
Fibonacci Calculator /
Mailing List /
Advertise Here /
Articles /
Financial Terms /
Brokers /
Software /
Holidays /
Stock Split Calendar /
Mortgage Calculator /
Donate
Copyright © 2004-2023, MyPivots. All rights reserved.
Copyright © 2004-2023, MyPivots. All rights reserved.

