Noone else have anything to contribute ??
outside of daytrader and the rare few comments from a couple of others very few people are contributing with debate/comments at all on the charts posted in this section. I find this extraordinary as normally traders are all opinionated ! Noone suggest other markets to look at, analyse, or talk different styles / interpretations. There is little debate and precious little feedback from others.
I agree with alleyb - this is a pathetic showing from the rest of you and I can understand alleyb getting getting tired with some of our conversations that are getting stale.
Let's have some more questions and opinions.
The reason that I don't think that there are lot of questions or comments here is because Market Profile is not an easy concept to grasp. I'm not saying that it's difficult but I am saying that it is more difficult that simple TA such as MACD, MAs, RSI's etc.
I also think that the winning 10% of traders use and understand Market Profile or some derivation thereof and that the 90% of losing traders don't apply Market Profile. That would imply that only 10% of the traders that read these threads would understand what is being discussed here and when they don't immediately understand what is happening they move on because it requires more than a few minutes to grasp - which circles back to why 10% of traders are successful to the detriment on the other 90%.
I don't have much to contribute as I am still learning MP. But I do find the postings here by daytrader and alleyb extremely helpful (btw I am now subscribed to both the MP Toolpack and Tradingclinic)
I do have a question though. As I read "Mind Over Markets", I have not not seen very much written about the significance of singles. Dalton writes about them in the context of tails, excess, range extension, and so on. My question has to do with the singles getting filled. Does MP dictate that all singles will eventually be filled?
A second unrelated question: Am I correct to assume that studying the LDB is not as a critical as it once was given the way volume is now reprted by the exchanges? and ...what is the relationship bewtween the LDB and the CoT report? Not that I understand either one yet, but I am wondering if I should devote some study time to these.
thanks.
Thanks for the comment popdoc. I'll let Ally answer the question about the COT and LDB because I think that he knows more about it than me.
Because the equity markets trend upwards in the long term this will mean that there will always be singles left below us that will never fill (unless a catastrophe takes the stock market to zero) and the singles above us will always fill. This is over the long term so some singles that are above us could take years to fill in.
Because the equity markets trend upwards in the long term this will mean that there will always be singles left below us that will never fill (unless a catastrophe takes the stock market to zero) and the singles above us will always fill. This is over the long term so some singles that are above us could take years to fill in.
COT report comes out on a friday night after hours and is the result of open positions up to the prior tuesday. It represents a breakdown of open positions by catorgary of trader. speculative and commercial. Long and short and the %s represented in each catorgary. Its not so much the actual numbers that one needs to look at but the changes and the story that unfolds from that. I analyse the COT report and post that file on my website each weekend and cover FX, Stk indices, Commodities & of course Bonds. I look at the COT report to confirm what I see unfolding in MP. If I notice something vastly different I defer to MP
As to LDB well that is only available from the CBOT. The other exchanges collate the data because the CFTC obliges them to but the exchanges choose not to publish it. So much for transparency ! There are other ways to analyse LDB in the profile. Suggest you go to the cbot web site and look at the MP page there and you will find MP102 . It is also on my website. This will give you a few clues how to identify and quantify the LDB without having to delve into the LDB
As to single prints they are minus development and when retested should on first test reject. If they gobble up the single prints then something else is going on and you have to be flexible to reading the unfolding VA and rotations as to whether you have chosen a bad level or not. Interesting to see the single prints in s&p last 3 odd days which are the result of mass exit from badly placed trades mainly recently the shorts .
As to nothing to contribute you have contibuted massively by being bold enough to ask a couple of questions. Questions = communication = desire for knowledge = learning = application to trade = $$$$ .
I just posted a new question under the Market profile forum and would still like to know about weekly range estimations..Alley B you may know that..the question is posted there too...I know just enough about MP to be dangerous.....The big question I still have about MP is really dealing with longer term distributions..I still don't see any consistency among MP practicioners and vendors so I would really like to know how do you determine how far back to look for longer term distributions....Ive seen:
5, 10 and 20 day - Don jones
monthly, weekly, quarterly - from somebody
Swings from the charts them selves..in other words use the current up to down move or down to up move
I feel MP falls short in defining this...at least for me....I do enjoy the charts here...How is the hidden pivot derived? Is it just a longer term POC..thanks for any insights...
Bruce
I think that part of the answer about "how far to look back" is (1) what type of trading are you doing? swing/day/scalp and (2) what time frame are you familiar and comfortable with.
The second point covers any type of chart and not just MP. Once you've been watching a 233 Tick or 13 Minute or 17,000 Volume or 9 tick Range chart you get used to that time frame and picking out patterns that work in that time frame.
So after studying a 1, 5, or 10 day composite MP chart you should start to be able to pick out setups and trade patterns that work in your market.
From what I see of Alleyb's postings he looks at a much longer time frame than I do and does further projections. I am guessing that he also holds positions for longer. Actually I'm not guessing because he's mentioned it here before that he frequently swing trades positions.
Hope that helps.
1.Defining weekly ranges. before I answer that I have to ask have you looked at MP102 . becasue the answer was given in that presentation
2.Consistency. Well I hope I show you consistency here.but in short yes Don Jones likes to talk about 5 , 10, and 60 day distributions.
Some have come up with adding the 20 for that fits more or less a month
The answer is multi-fold
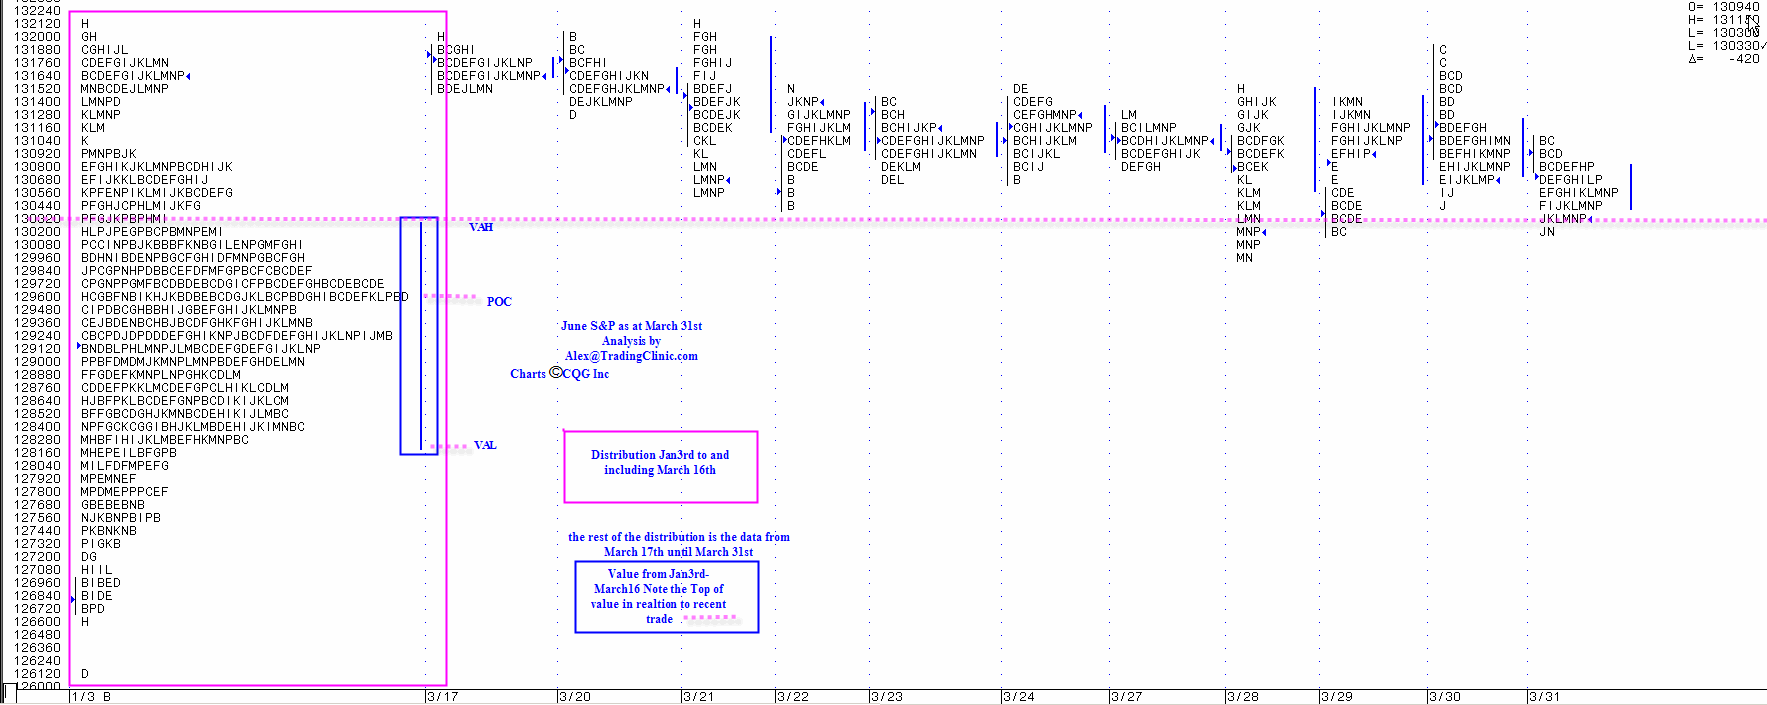
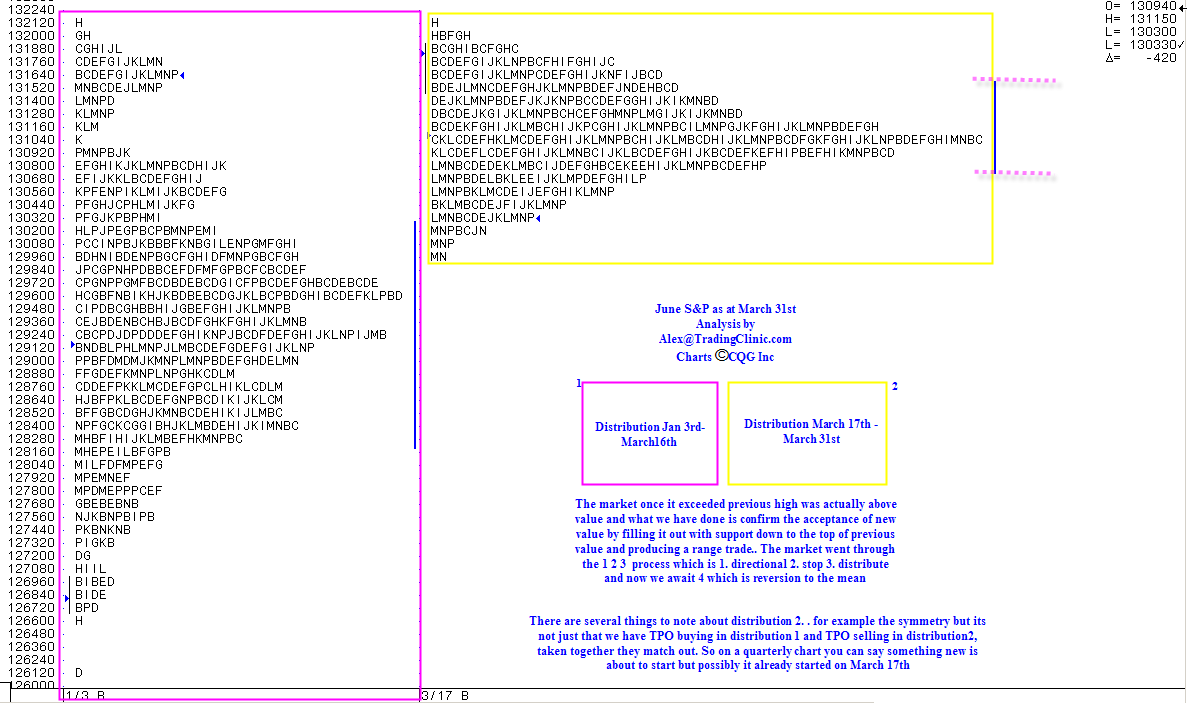
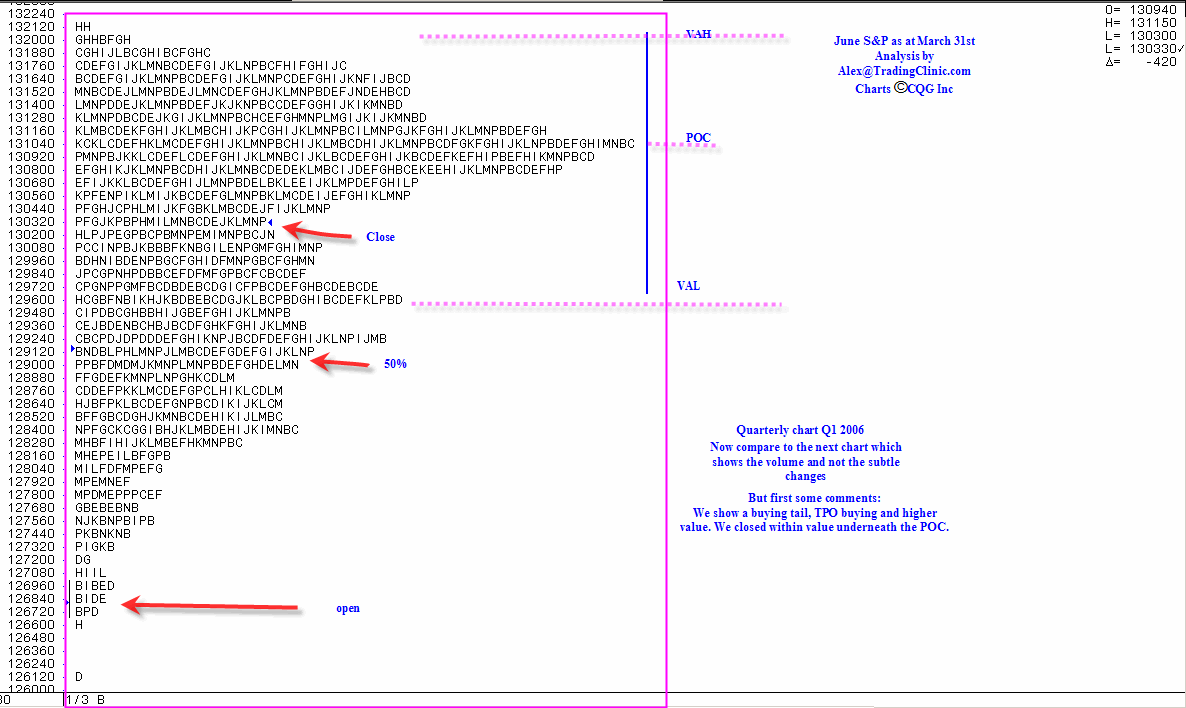
look for the obvious start and end of something. so We started the year clearly with something new and so far it had a minimum target of 1321.5 so that is where it ended Mar 16th. thats one distribution. so then you take the distribution from then till now for it has only achieved a minor target to date rather than the slightly larger timeframe ones
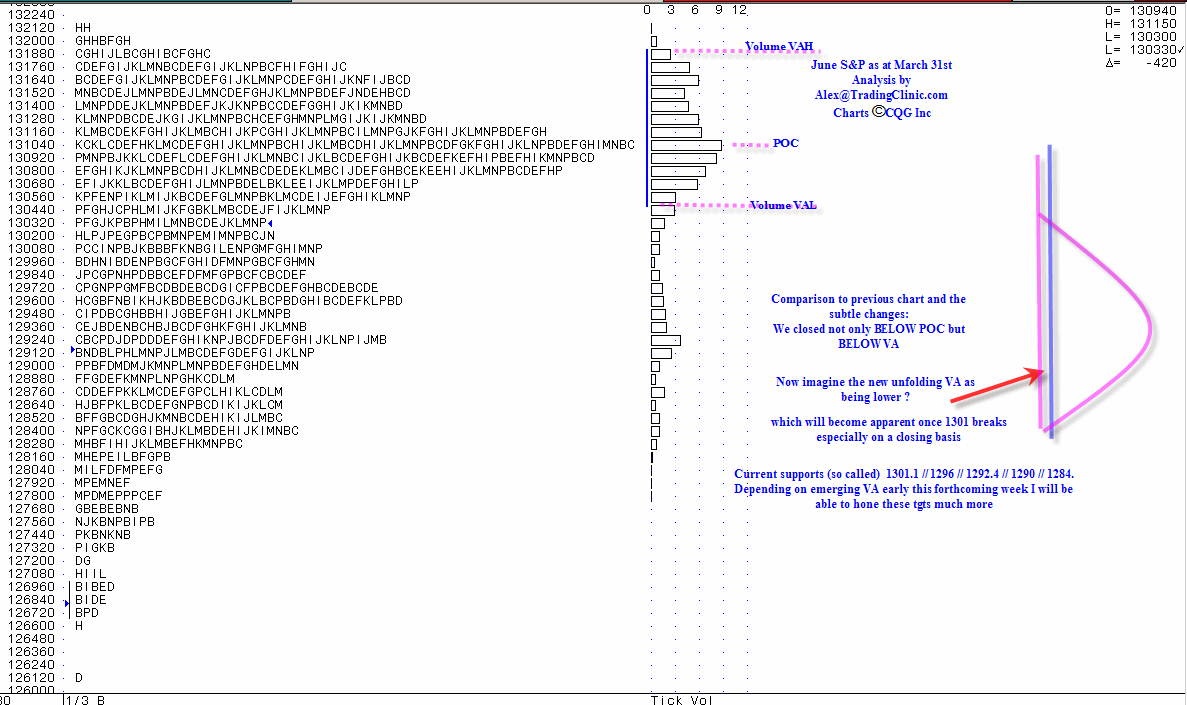
and you keep going with that until it achieves tgts. look at the charts I shall post next on this and hopefully the visual will help you
3.Hidden MP Pivots. they are inflection points in the profile.
4.I urge all students of MP to go if not to my website then at least go to the CBOT and get MP101 & MP102. In my website I offer everything you need to know about MP and so much more including a complete drill down right the way through Don's website plus a manual that goes and explains AND teaches the CBOT handbook as well as a CD course that takes you from beginner through intermediate to advanced. I show techniques that do not require to look into the actual LDB data for that is only available on CBOT product and much much more. I show rules for trading both from an entry as well as an exit strategy etc etc
Thanks for the help with this..I have seen your 101 and 102 presentations they are excellent and have been a big help....but now your messing me up by showing two different profiles....volume and time at price..lol..that can open up a whole new debate...
Bruce
Bruce
So as not to confuse you any further then the answer my friend is to buy my MPCourse which is only 395 unless of course you are an annual Member of my website in which case its only 200.
Emini Day Trading /
Daily Notes /
Forecast /
Economic Events /
Search /
Terms and Conditions /
Disclaimer /
Books /
Online Books /
Site Map /
Contact /
Privacy Policy /
Links /
About /
Day Trading Forum /
Investment Calculators /
Pivot Point Calculator /
Market Profile Generator /
Fibonacci Calculator /
Mailing List /
Advertise Here /
Articles /
Financial Terms /
Brokers /
Software /
Holidays /
Stock Split Calendar /
Mortgage Calculator /
Donate
Copyright © 2004-2023, MyPivots. All rights reserved.
Copyright © 2004-2023, MyPivots. All rights reserved.


