ES Friday 6-23-17
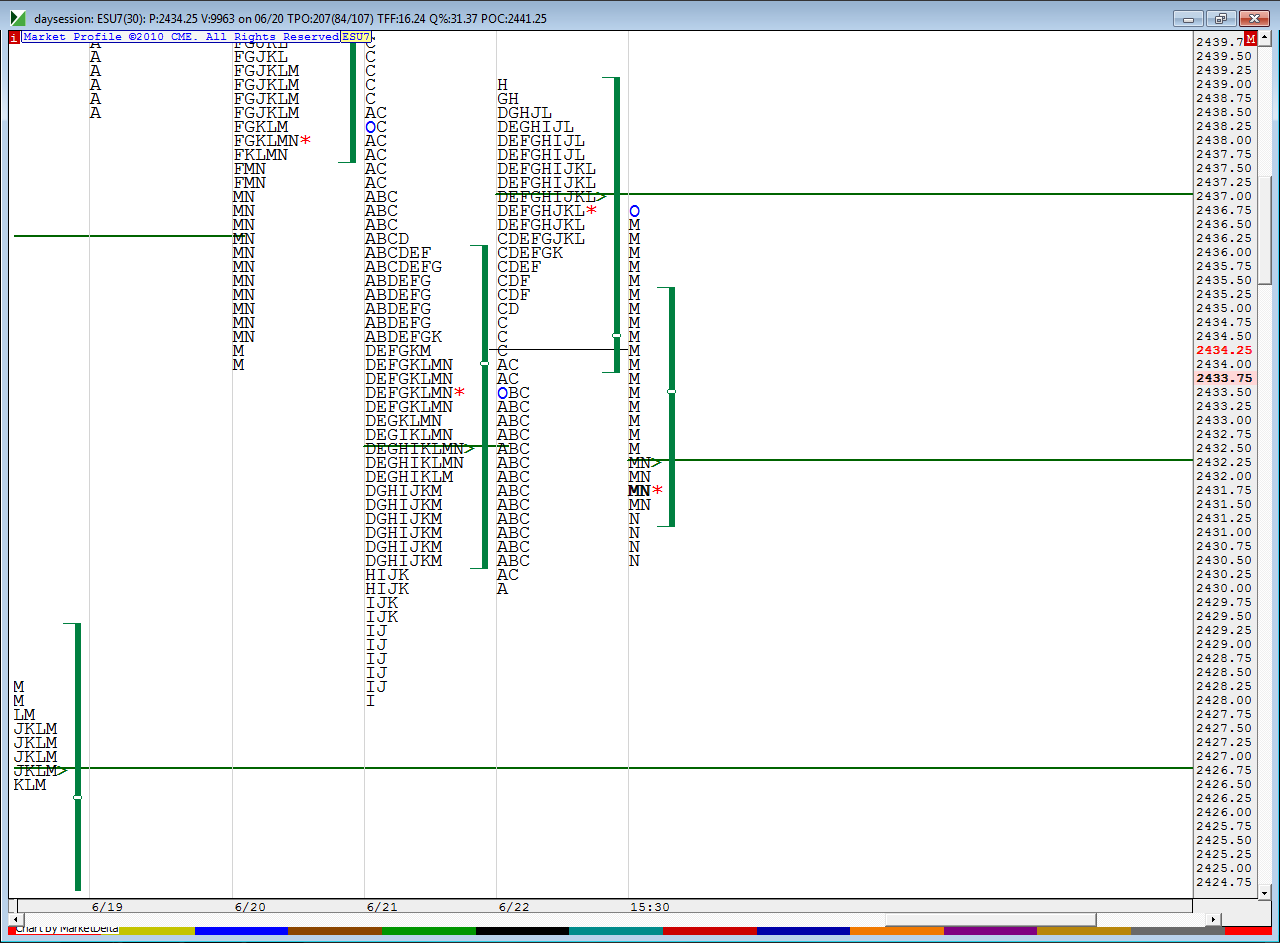
very poor environment for trading and it's Friday...first chart shows the breakdown point from yesterday in "M" period...( I split it out)..so that 36 - 37 is the price sellers want to see it stay under in order to get poor lows mentioned yesterday ( R1 is at 2437 too) ...so we have some confluence there
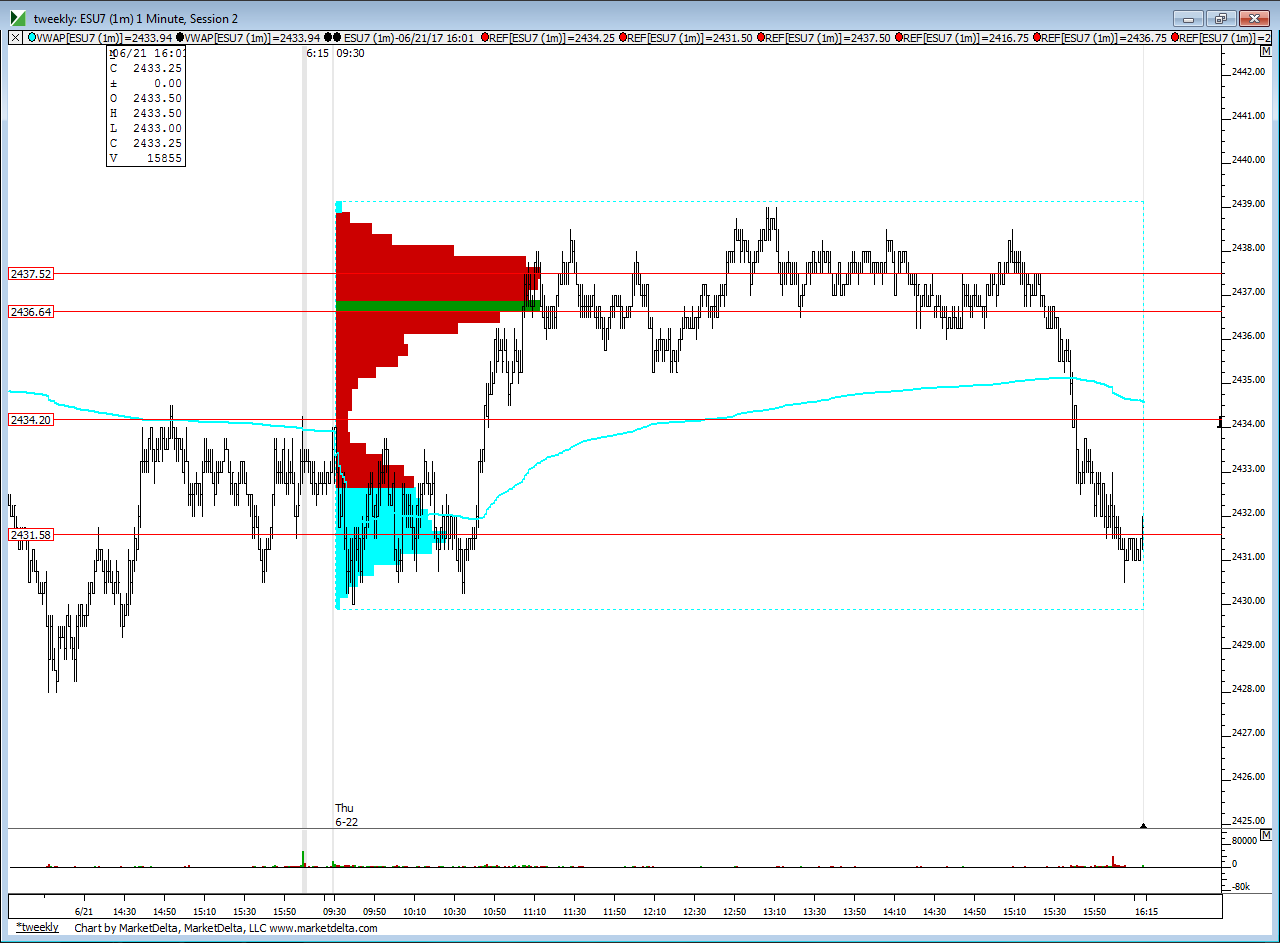
second chart is my favorite and shows how we had two bell curves yesterday separated by a low time spot at 33- 34.....Pivot number today is 33.50 for more confluence.
we also had the close right near center of lower bell at 31.50 and that is only two points away from the pivot/ low time area above...so that makes things more difficult when we have numbers close by
S1 sits down at 2428 which is right near wednesdays poor low and the poc from last week at 2427..........we also have a poor high from yesterday so we can't get too bearish with that sitting up there.......good luck today...I think we will need it...my plan is to trade for 33.25 test from 2435 and above here in Overnight session...not very grand byt that will have us hitting back to current overnight midpoint which happens to be the VA low from yesterday too
Thanks Bruce.. I would also point out the O/N Low and RTH Low are double bottoms (2430) and area of interest. This is 2 days in a row where this happened (2428 for Thurs, also area of interest). These numbers all coincide with the Volume VA Low at 30.50 and S1 at 28. With a balanced market and being Friday, I would not be surprised if we take out some of these areas. Upside potential would be to hold over 37 (as Bruce stated) and test O/N and PD highs at 38.50 and 39.00 respectively.
rth plan is to buy into 31 - 32 in order to go get pivot midpoint area above
data issue today on my Ib data...frustrating
I am getting long down here at 31 area as well.. Its either responsive down here at VA Low and double bottom or we go right through it
I thought midpoint hadn't been tested but a refresh shows it had....so I was long off 31 but now don't have the confluence I had hoped for.....all that is left is that I know it will be S1 or the pivot that prints today...I'm going flat till I figure out my data
if we can go back above 31.50 BEFORE s1 prints then I will try the long otherwise I am standing aside and will miss short side but I will look for longs in 27 - 28 area and keep it small
Well the our DB/VA low was exceeded (2430.50-30.00) now so I am thinking this may now be a move to the downside. We have double bottom from previous day at 28 and S2 at 28.25.. if we bounce back up to 30 area this may be a shorting opportunity
any longs will use 30.50 as a target so we need to be at least two points below that to initiate
I'm leaning long ..Ym hit almost perfectly into POC from last friday at 21281- 21289 so as long as that can hold or even if we diverge with ES then longs will still have a shot...I'm not showing any official print through or touching S1 yet either so maybe they will go for pivot above...wishful thinking perhaps
s1 at 28.25 hit to the tick on that dip low fwiw
Just noting the PD high and O/N high held up at 38.50-39, looks like we're getting a nice reaction off this level
Emini Day Trading /
Daily Notes /
Forecast /
Economic Events /
Search /
Terms and Conditions /
Disclaimer /
Books /
Online Books /
Site Map /
Contact /
Privacy Policy /
Links /
About /
Day Trading Forum /
Investment Calculators /
Pivot Point Calculator /
Market Profile Generator /
Fibonacci Calculator /
Mailing List /
Advertise Here /
Articles /
Financial Terms /
Brokers /
Software /
Holidays /
Stock Split Calendar /
Mortgage Calculator /
Donate
Copyright © 2004-2023, MyPivots. All rights reserved.
Copyright © 2004-2023, MyPivots. All rights reserved.

