ES 11-10-16
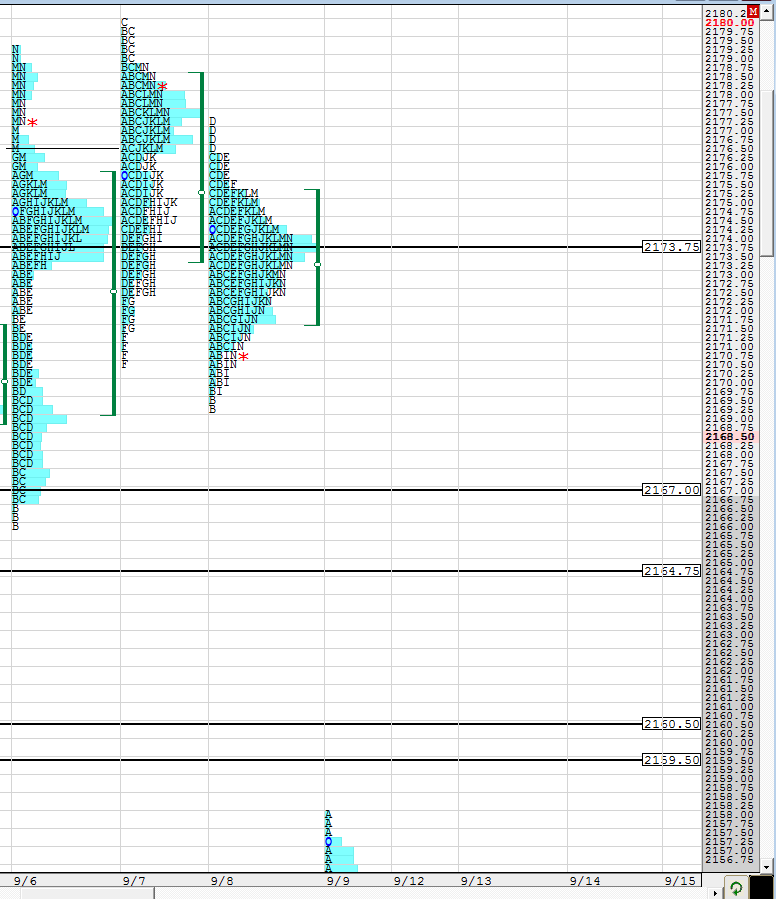
key area for me will be 2173.75 in early premarket trade...would like to find a short in 73.5 - 75 area to try and get back to YD's rth highs......looking to get some charts up and will edit this post with those
edit...first the upper portion of Wednesdays trade with key areas from that.....let me say this..... HUGE VOLUME yesterday with only the nq slightly behind but AD line is also still diverging...so we've had three higher highs in price but three lower lows in ad line.....
edit 2 ...a view of the profile from 9-6 thru 9-8 ..note the perfect bell center on 9-8 and that is why I took premarket short
statistically we will hit either the R1 or the pivot number today and get that right over 96% of the time.....today's pivot is way down at 2148.75 and R1 is up at 2178.75...59 will be the deciding factor to determine which one of those we get....so far price will be opening much closer to the 78.75 so anyone buying will be using that 73.75 - 75 area as a caution area on the way to the R1 if price happens to go that way.....no midpoint test yesterday too
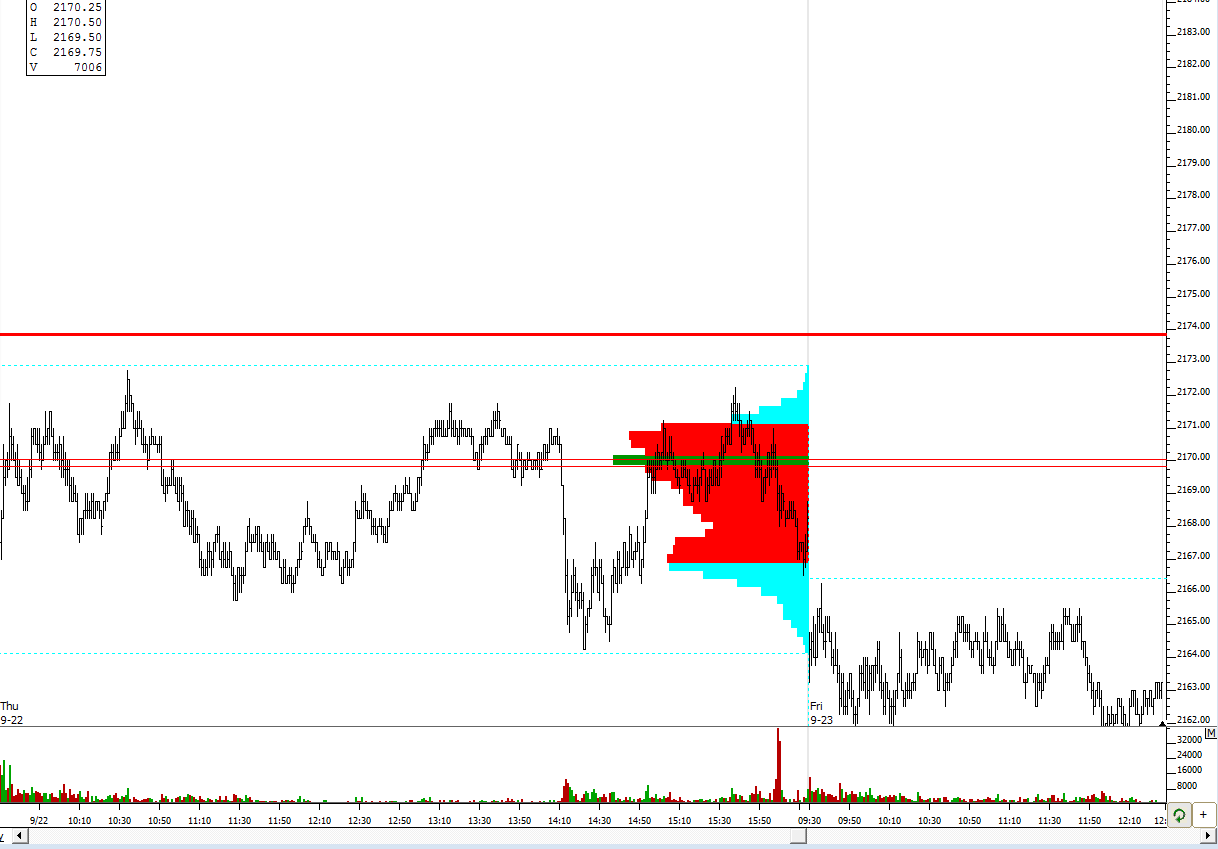
edit 3 : if you are looking to add another line to watch it would be this one at 69.75 from 9-22 trade
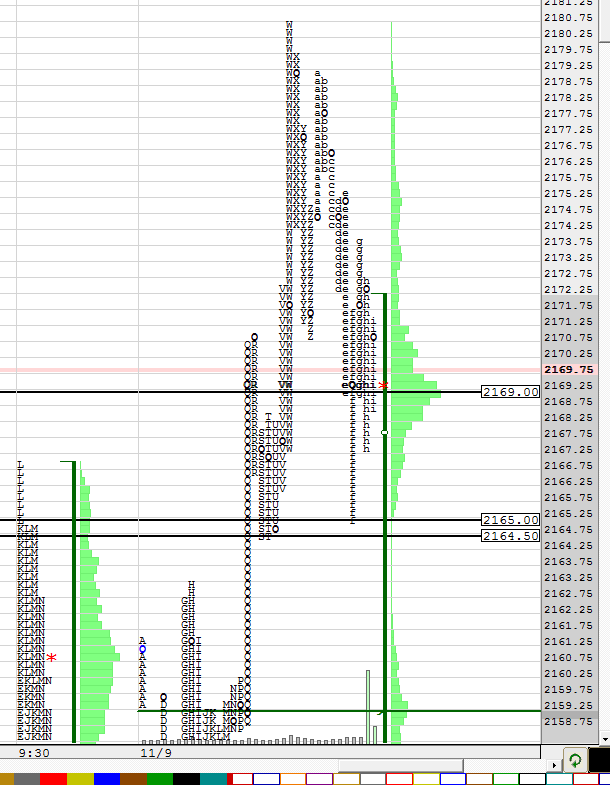
edit 4 ..and finally look at the 69 in the overnight...all the volume ( green horizontal histogram) is building there
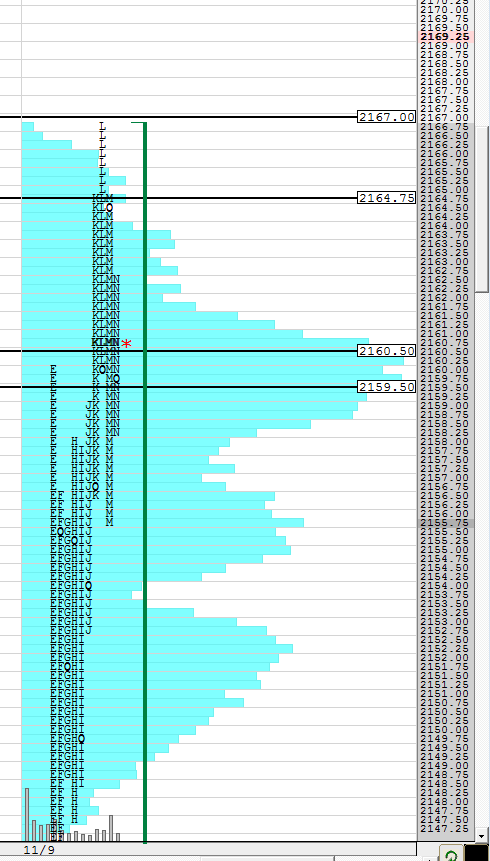
and last but not least is some context
for those holding...in order for floor number stats to fulfill they actually have to trade at the price on the chart ...so far we missed the R1 ....so if you can and you think it's wise then try to hold for the offical pivot print...........good luck...c ay all on monday....cool day but tricky
Emini Day Trading /
Daily Notes /
Forecast /
Economic Events /
Search /
Terms and Conditions /
Disclaimer /
Books /
Online Books /
Site Map /
Contact /
Privacy Policy /
Links /
About /
Day Trading Forum /
Investment Calculators /
Pivot Point Calculator /
Market Profile Generator /
Fibonacci Calculator /
Mailing List /
Advertise Here /
Articles /
Financial Terms /
Brokers /
Software /
Holidays /
Stock Split Calendar /
Mortgage Calculator /
Donate
Copyright © 2004-2023, MyPivots. All rights reserved.
Copyright © 2004-2023, MyPivots. All rights reserved.


