ES Thursday 10-27-16
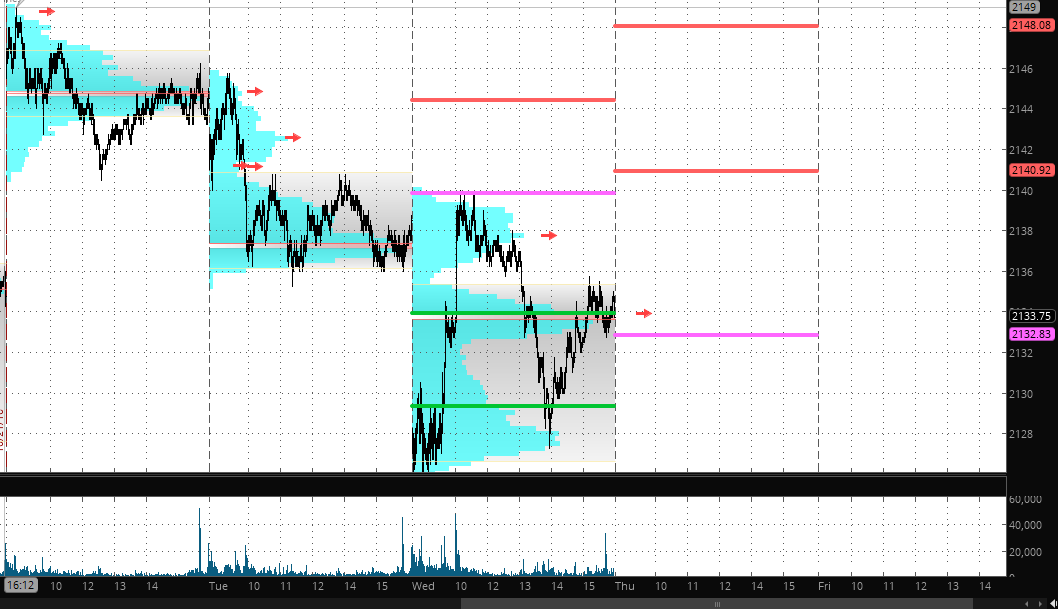
Keeping this simple today...note the arrows from Tuesdays trade...we have low time at 40 and a high time at 42.50...which is real close to the R1 today at 41 so that is a zone to me...45 splits r1 and r2 and is the key dividing line for bulls and bears today....that was also the poc from monday so good confluence there too......R2 goes well with Mondays highs...from Wednesday I am using 38 and also the pivot and poc at the 33 - 34 zone
we are up at 41 as I am typing this so we need to decide if they will print R1 and R2 today or will they stumble and go back through the R1 and try to drive it back to the 38 and then the 33- 34 zone ...Use 45 to tell if u will get to R2 and use 38 to tell if u will get to the Pivot
I like the idea of using 38.25 as a magnet in early trade but will revise plan the closer we get to the open
my plan is to trade for a 41 retest
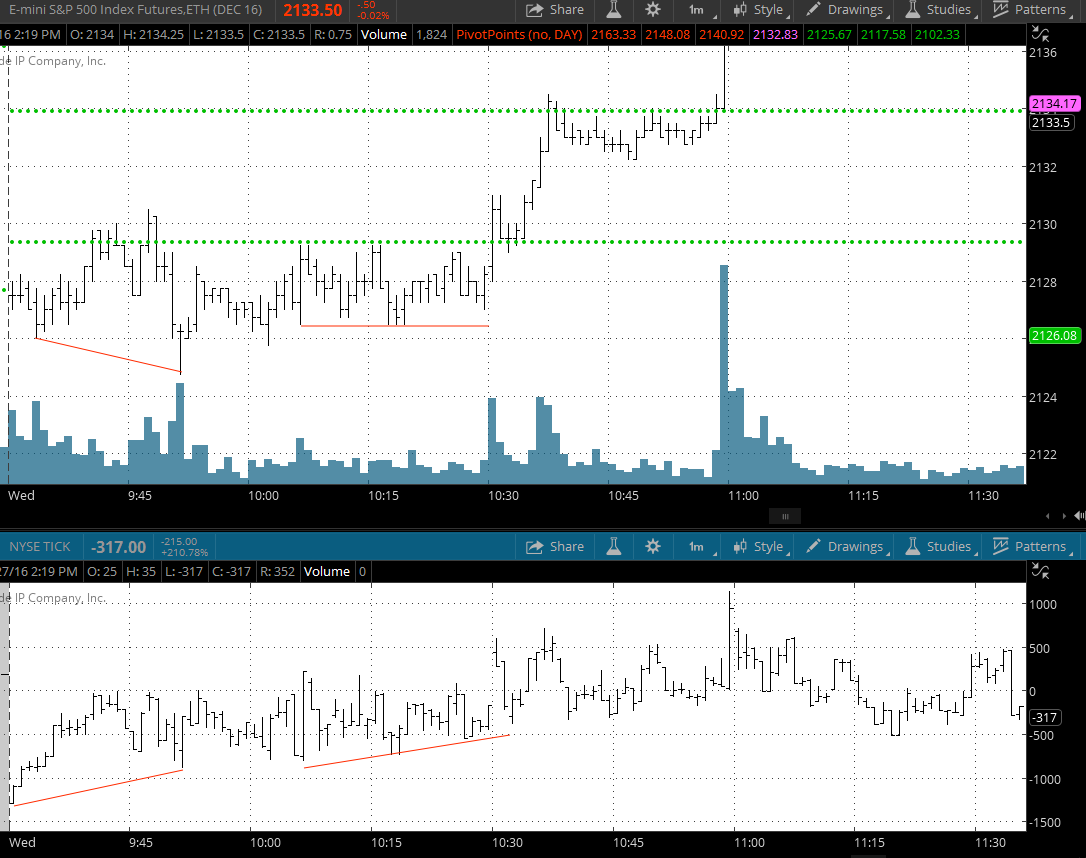
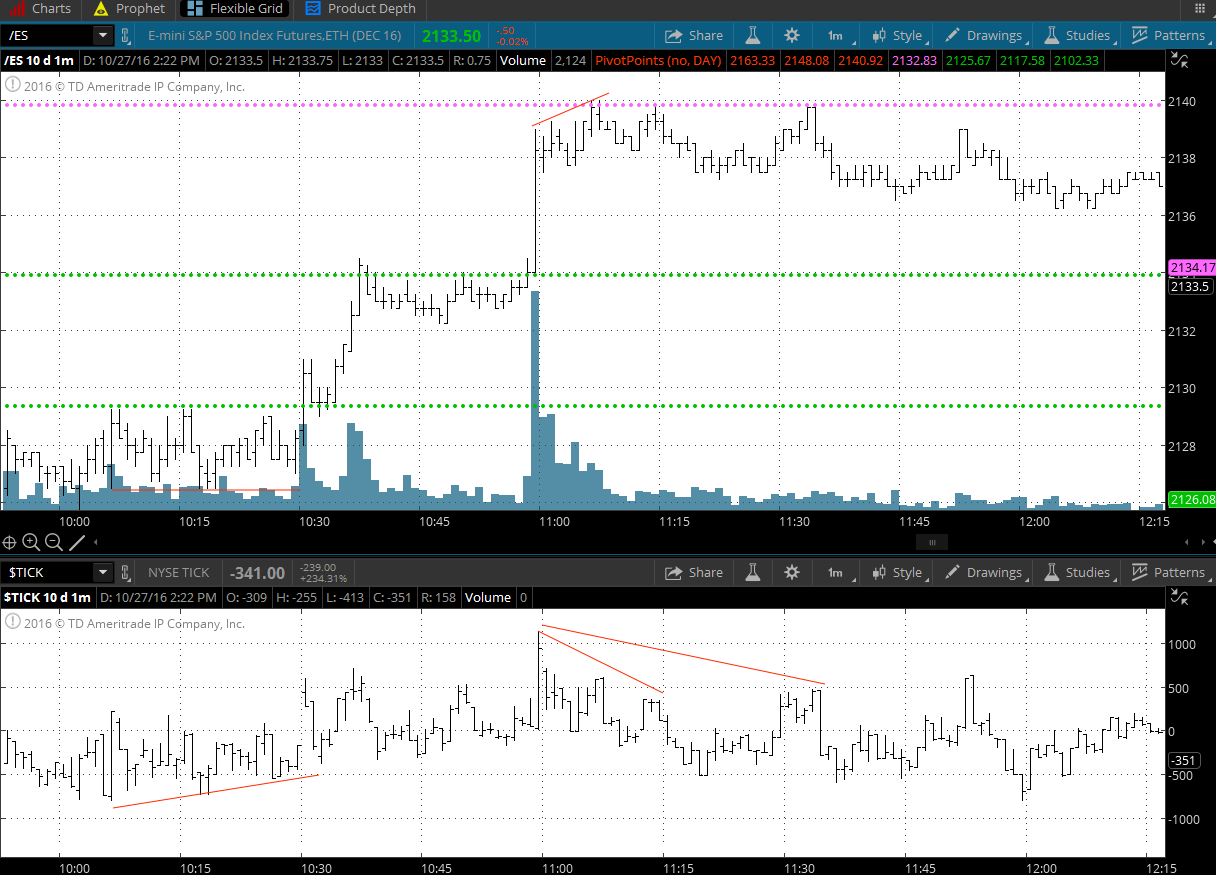
a few $tick divergences....the key to any of these is to find out where they are happening ( chart points predefined) and watching volume...so most often you will see a big volume push and then the $ tick divergence with price to possibly set up some type of reversal ...here are a few from Wednesday in early trade...u can also use $Tick in ranges and you can see $ tick wedge higher ( or lower ) as price remains flat...it can sometimes give a clue to future direction
Naturally I am concentrating on the early tests in this example as most know that is my time to trade.....so basically the best trades will come when
1) you get a big volume thrust
2) Price continues to go higher or lower after the big push and volume thrust
3)at the same time as #2 we get a $tick divergence and a natural dry up in volume....this can show that somebody is not hitting bids or offers as aggressively as they did earlier and the move isn't attracting broad participation
this is the classic fade setup
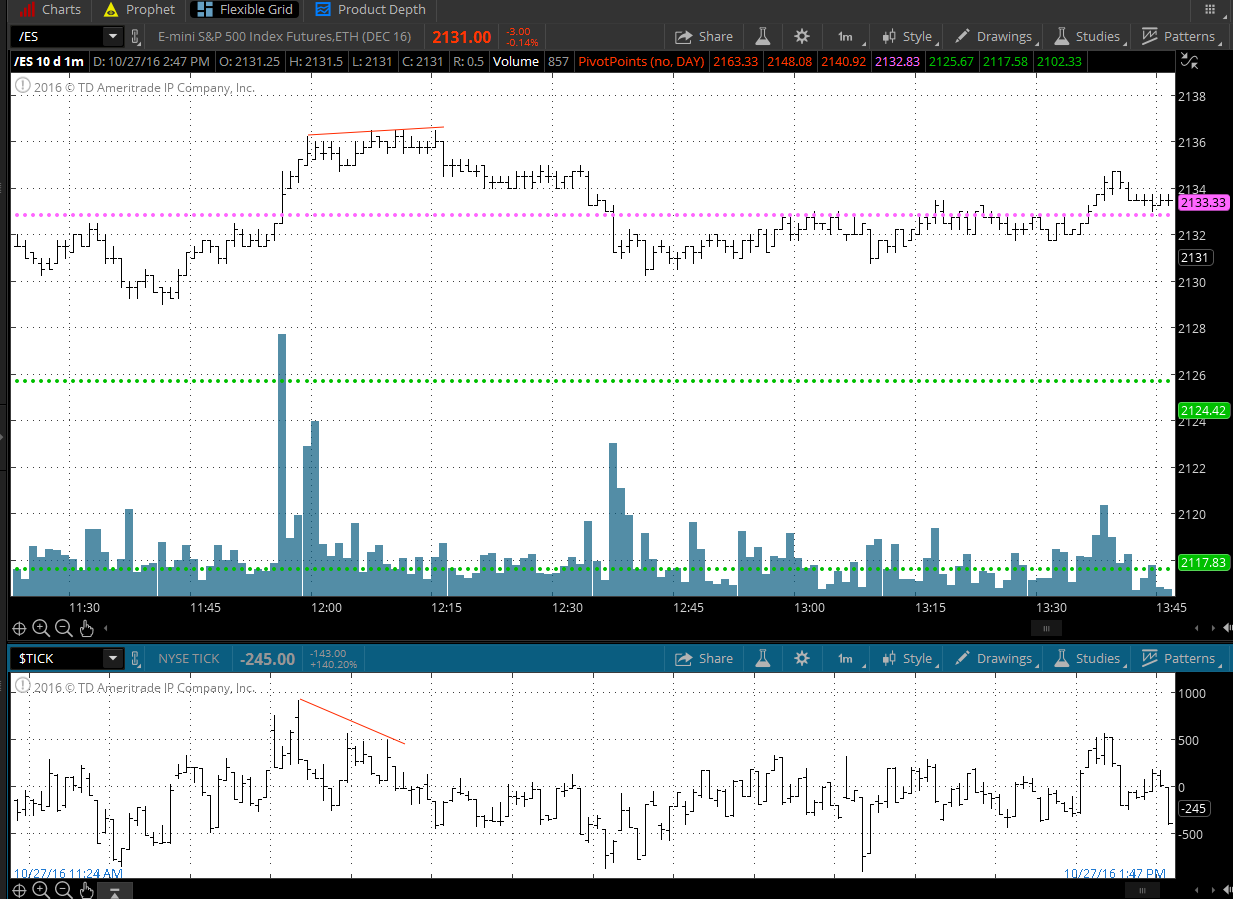
and here is one from today...note the big volume as we push through the pivot point number....then volume dries up and the $tick diverges at the same time
Emini Day Trading /
Daily Notes /
Forecast /
Economic Events /
Search /
Terms and Conditions /
Disclaimer /
Books /
Online Books /
Site Map /
Contact /
Privacy Policy /
Links /
About /
Day Trading Forum /
Investment Calculators /
Pivot Point Calculator /
Market Profile Generator /
Fibonacci Calculator /
Mailing List /
Advertise Here /
Articles /
Financial Terms /
Brokers /
Software /
Holidays /
Stock Split Calendar /
Mortgage Calculator /
Donate
Copyright © 2004-2023, MyPivots. All rights reserved.
Copyright © 2004-2023, MyPivots. All rights reserved.


