KISS - Keep it Simple Scalping
Standard Operating Procedure for entering Long position scalps :
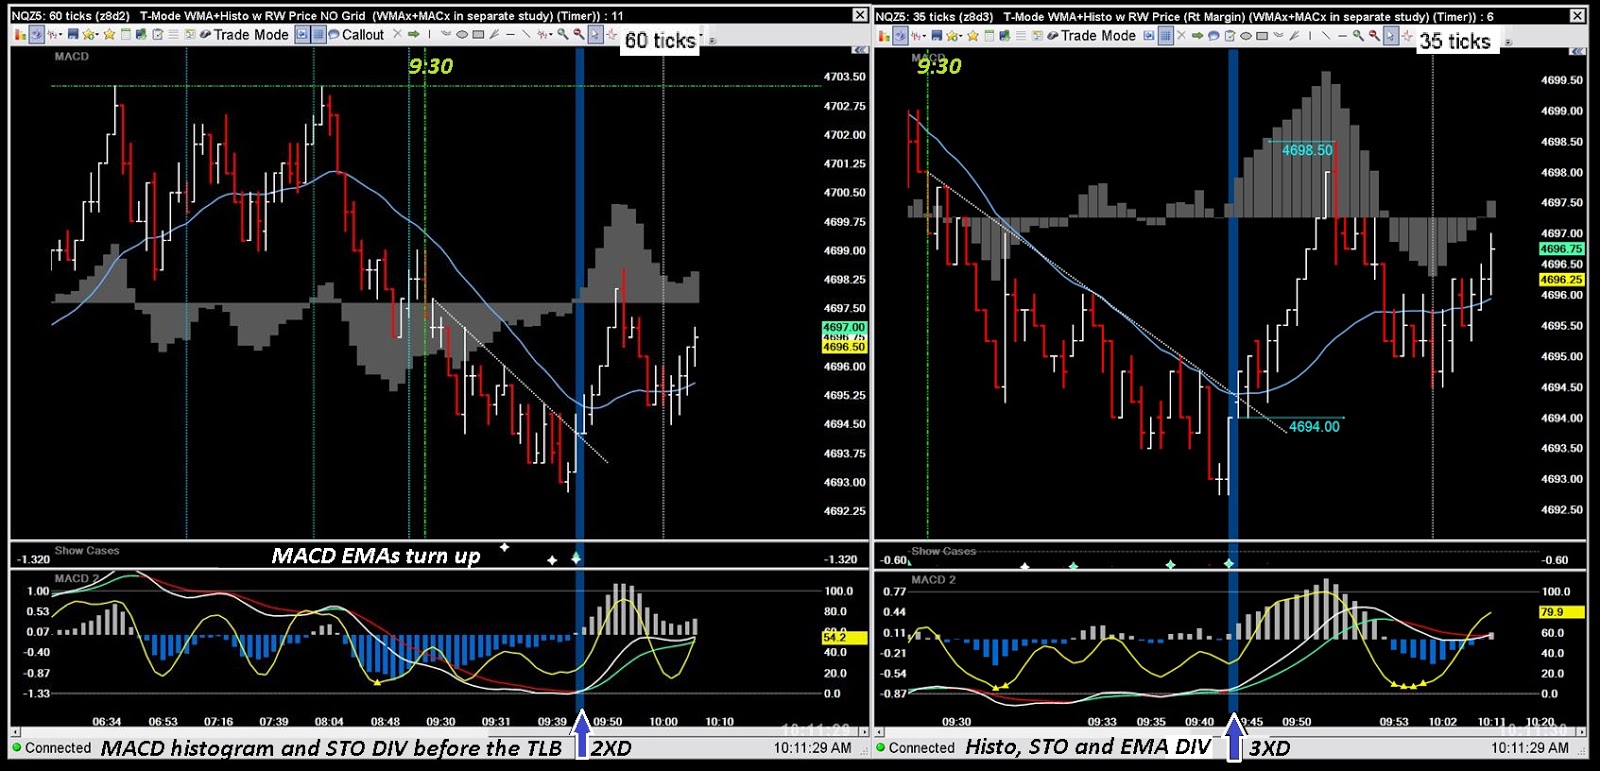
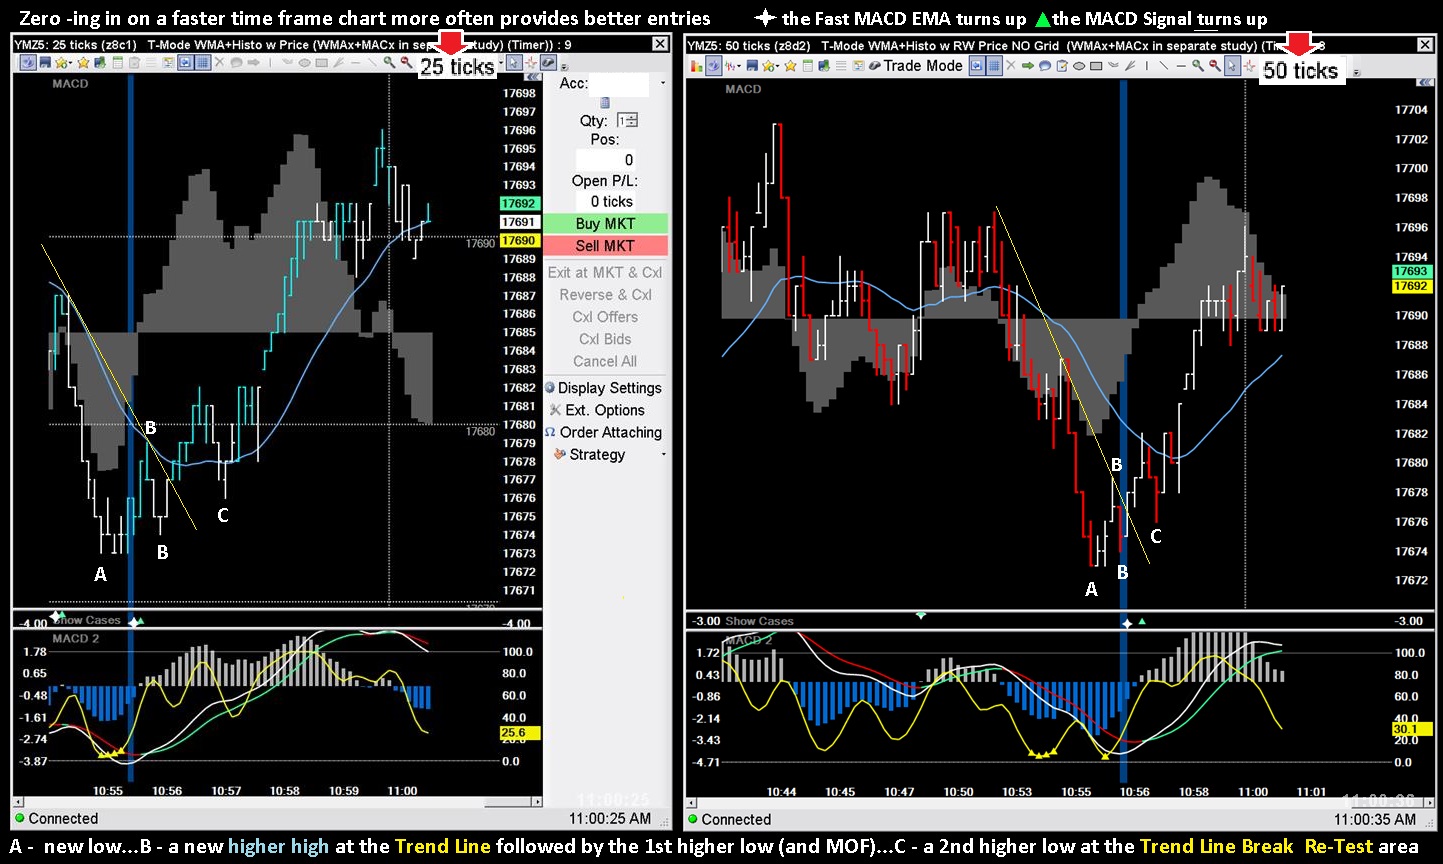
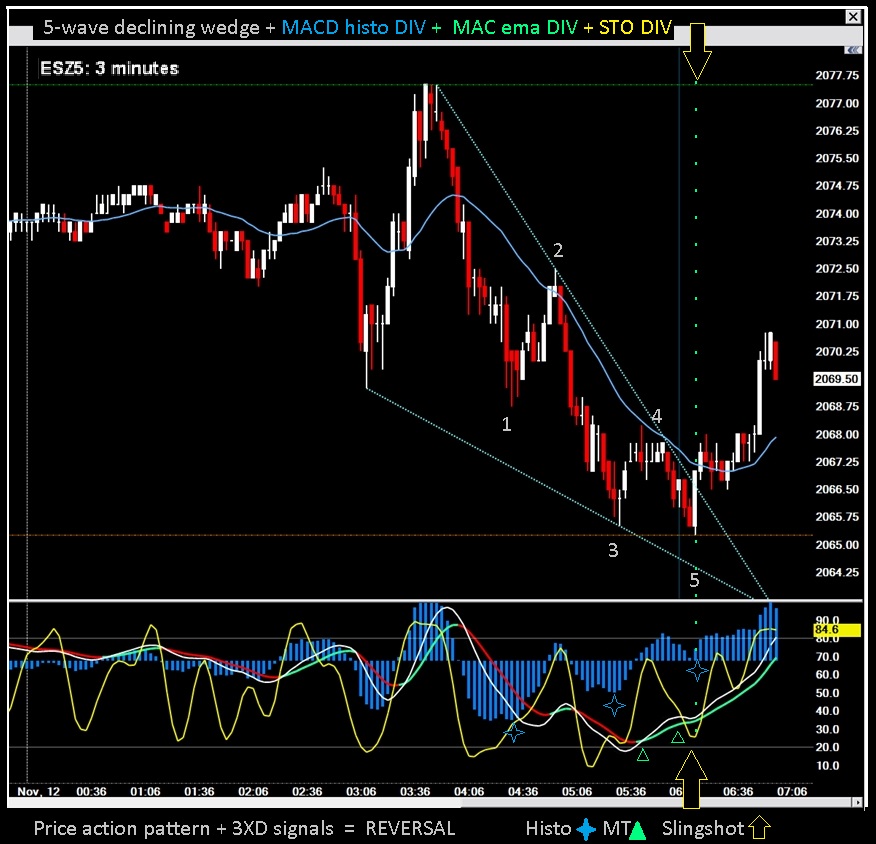
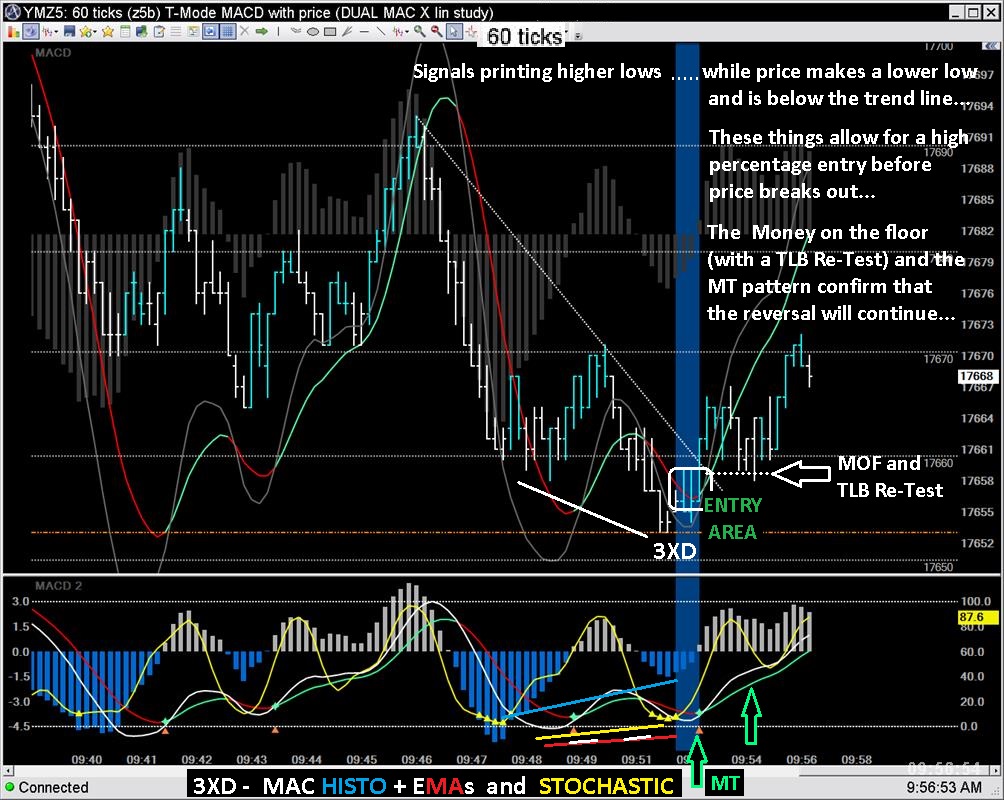
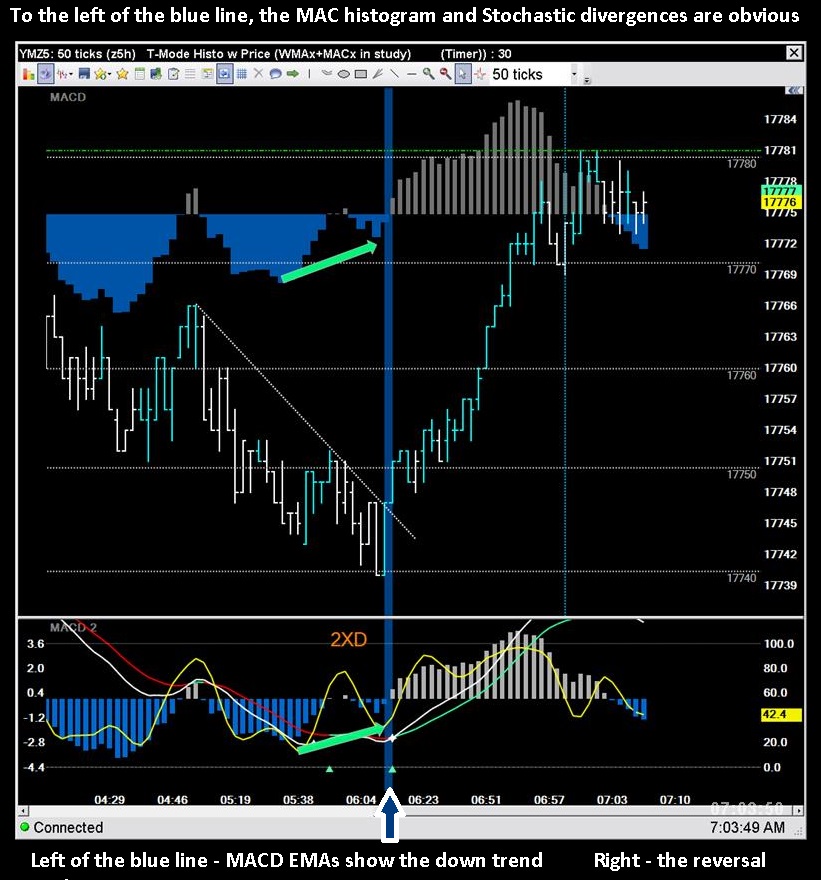
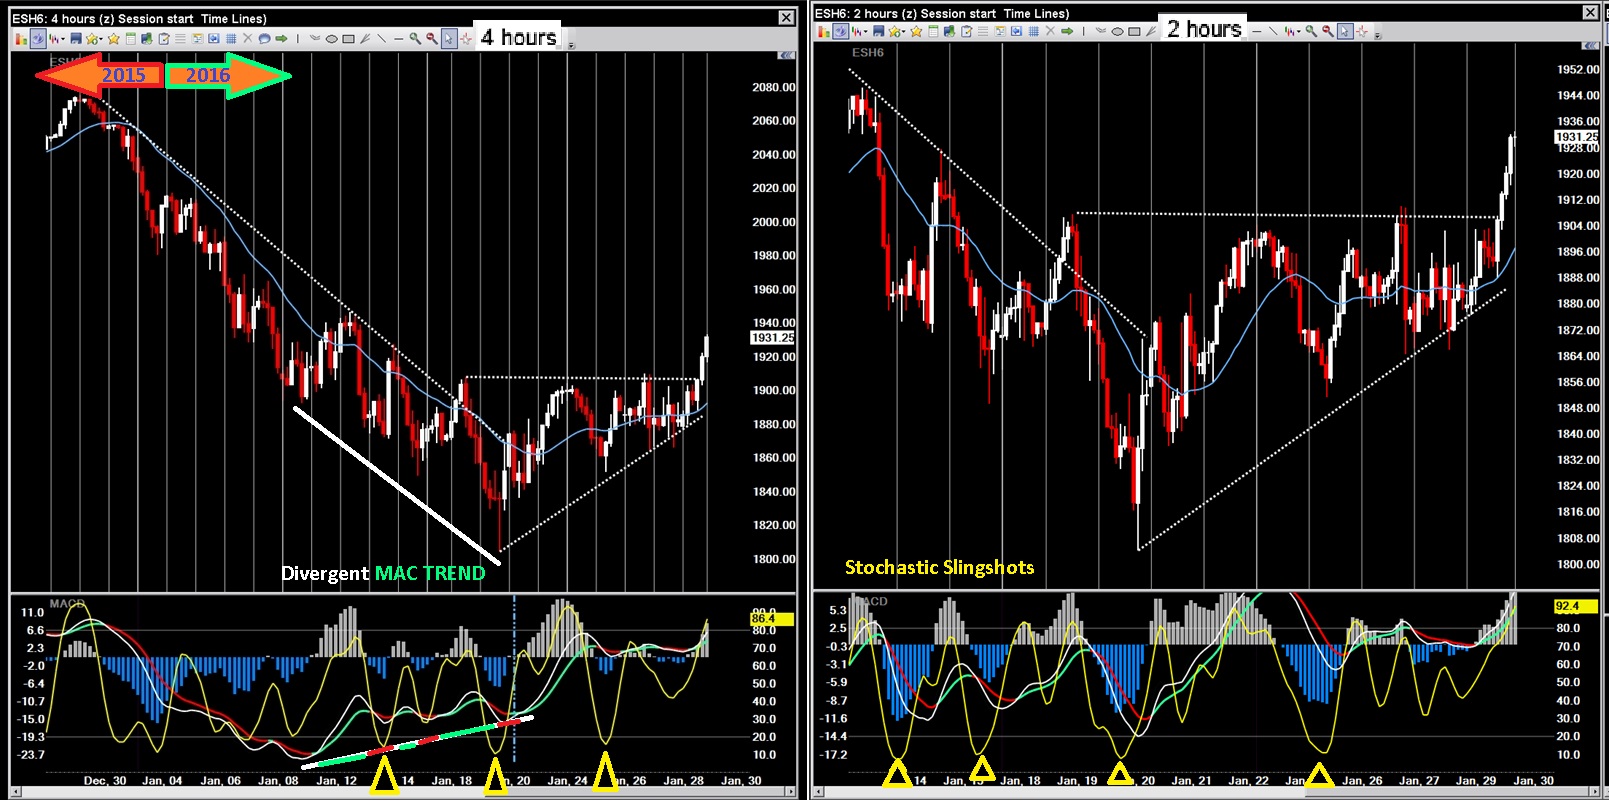
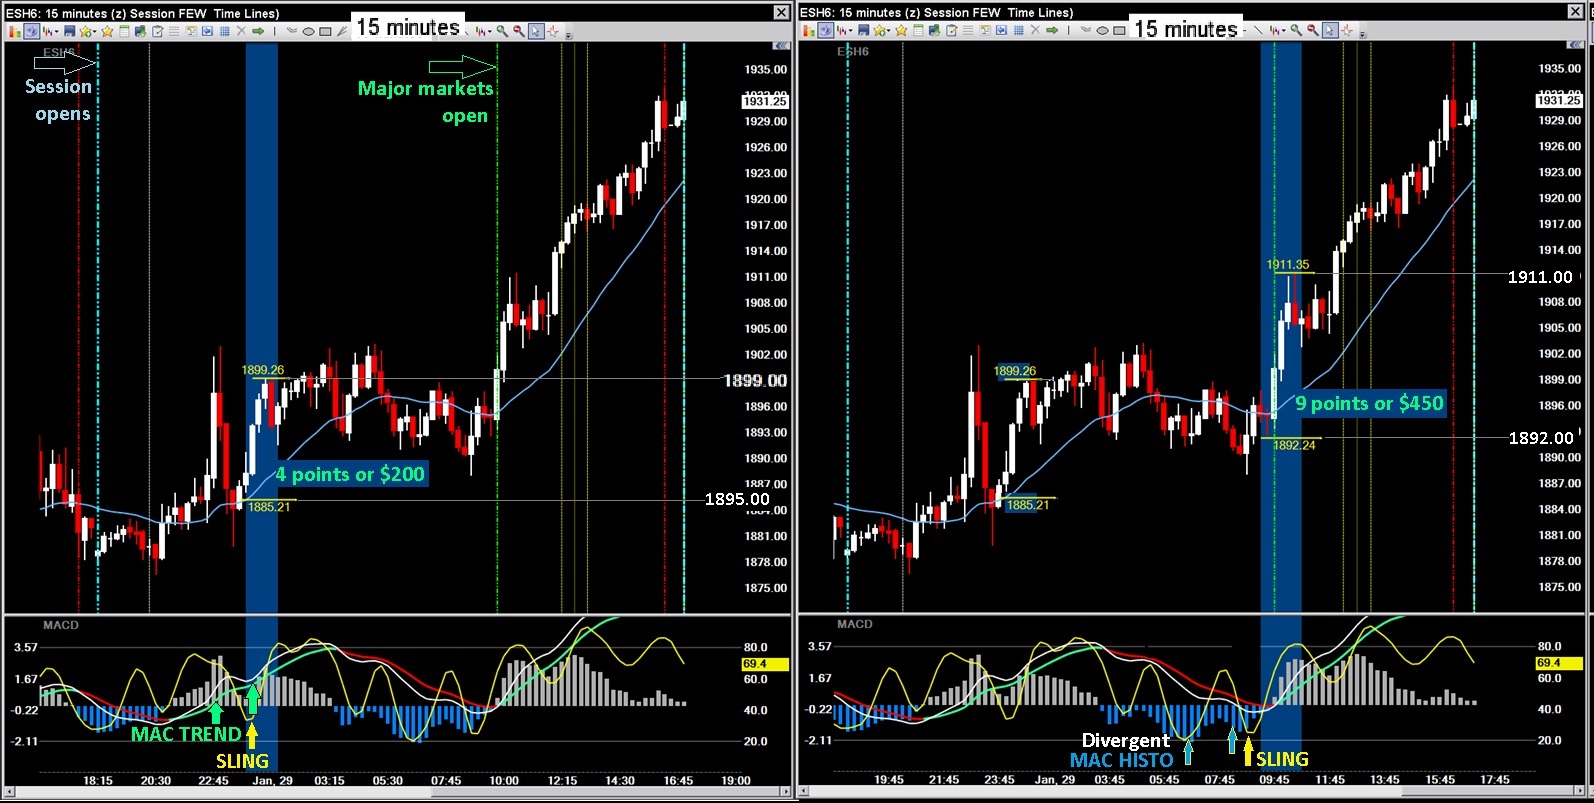
Watch multiple Time frames for Signals (Indicator to price Divergences) before Price breaks out above a down trend Line.
These patterns and signals occur in ALL markets and on ALL time frames ...ALL THE TIME.
Watch multiple Time frames for Signals (Indicator to price Divergences) before Price breaks out above a down trend Line.
These patterns and signals occur in ALL markets and on ALL time frames ...ALL THE TIME.
Here are some more examples with some variations on the KISS theme...
sharpshorts,
what is MOF (Money on Floor), just a Higher Low?
what is MOF (Money on Floor), just a Higher Low?
Sorry for the late reply - I got blocked from signing in...I think it was because I included links to my blog to further explain the charts I posted.
It didn't occur to me until now to register again with a different email and user name ...Anyway:
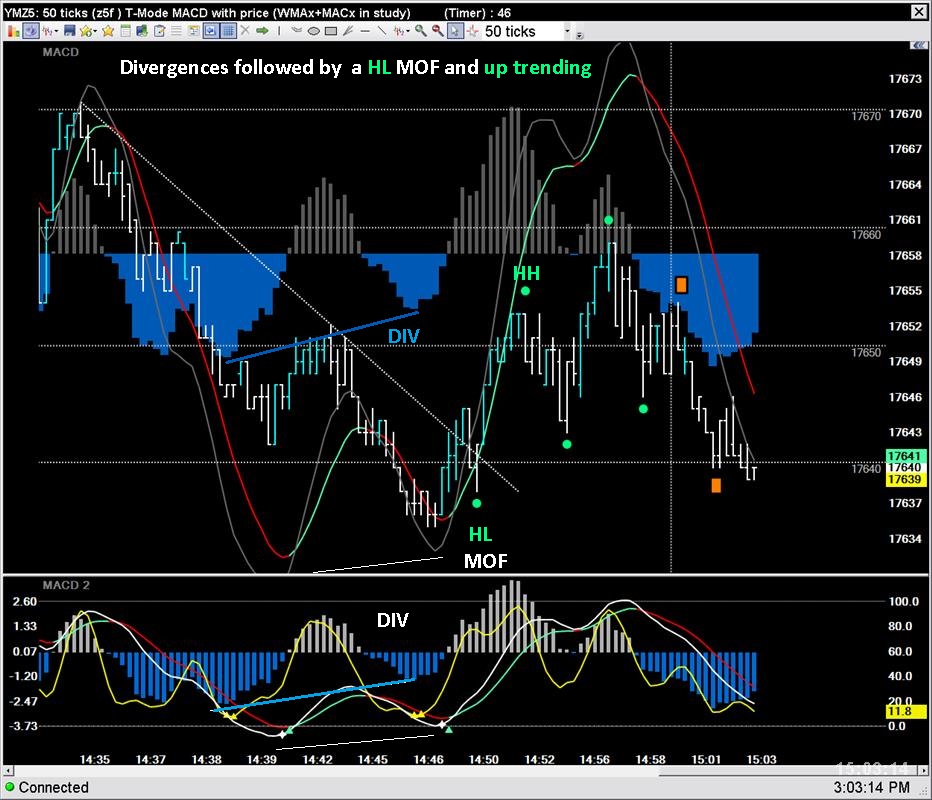
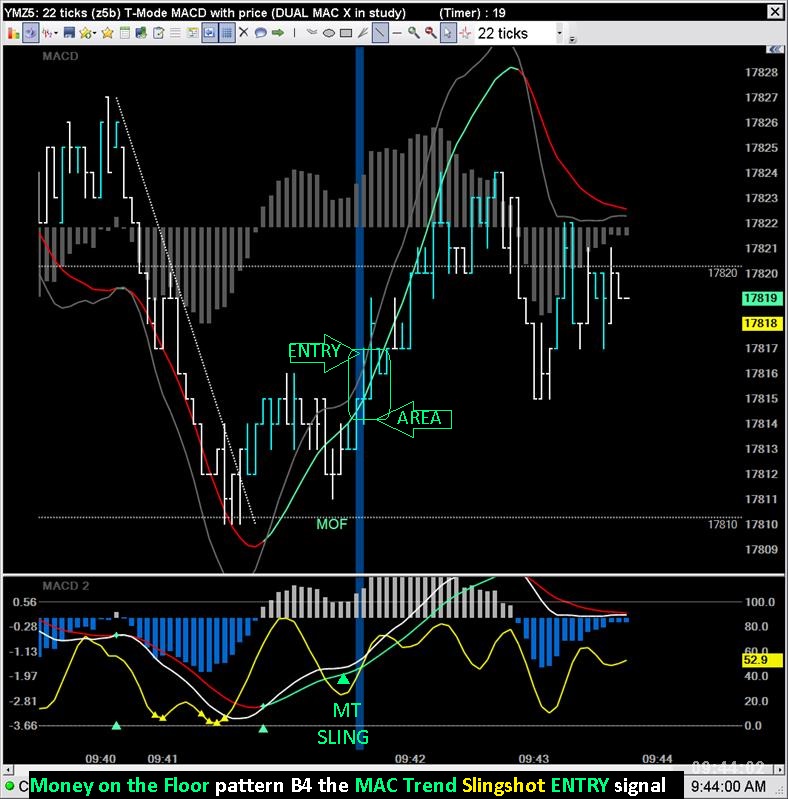
A MOF (Money-on-the-Floor) pattern is the first higher low of a new up trend...
It is sometimes hard to ID it until a new higher high prints AFTER the 1st higher low.
But if you use other signals to anticipate an MOF and take a position, it allows for using a very tight stop-loss for protection should the MOF "fail" to print.
Other signals - like an over-sold stochastic and/or a Re-Test of the previous down-trend-line break-out area to front-run a potential trend reversal.
ok,
thanks
thanks
generally what kind of stop and profit do you use for your scalping strategy just curious
I use very tight automatic bracket orders for each trade...
For the YM and RUT, a 4 tick stop and a 10 tick initial target...for the ES, 3 and 6.
I am a scalper, I'm in and out many times a day.
But I contend that the price action patterns and indicator signals that I've shown in the charts
above can be applied to longer time periods than I use - for swing trading or investing.
The stop and target numbers are based on my personal statistical trade history which includes 1000's of trades
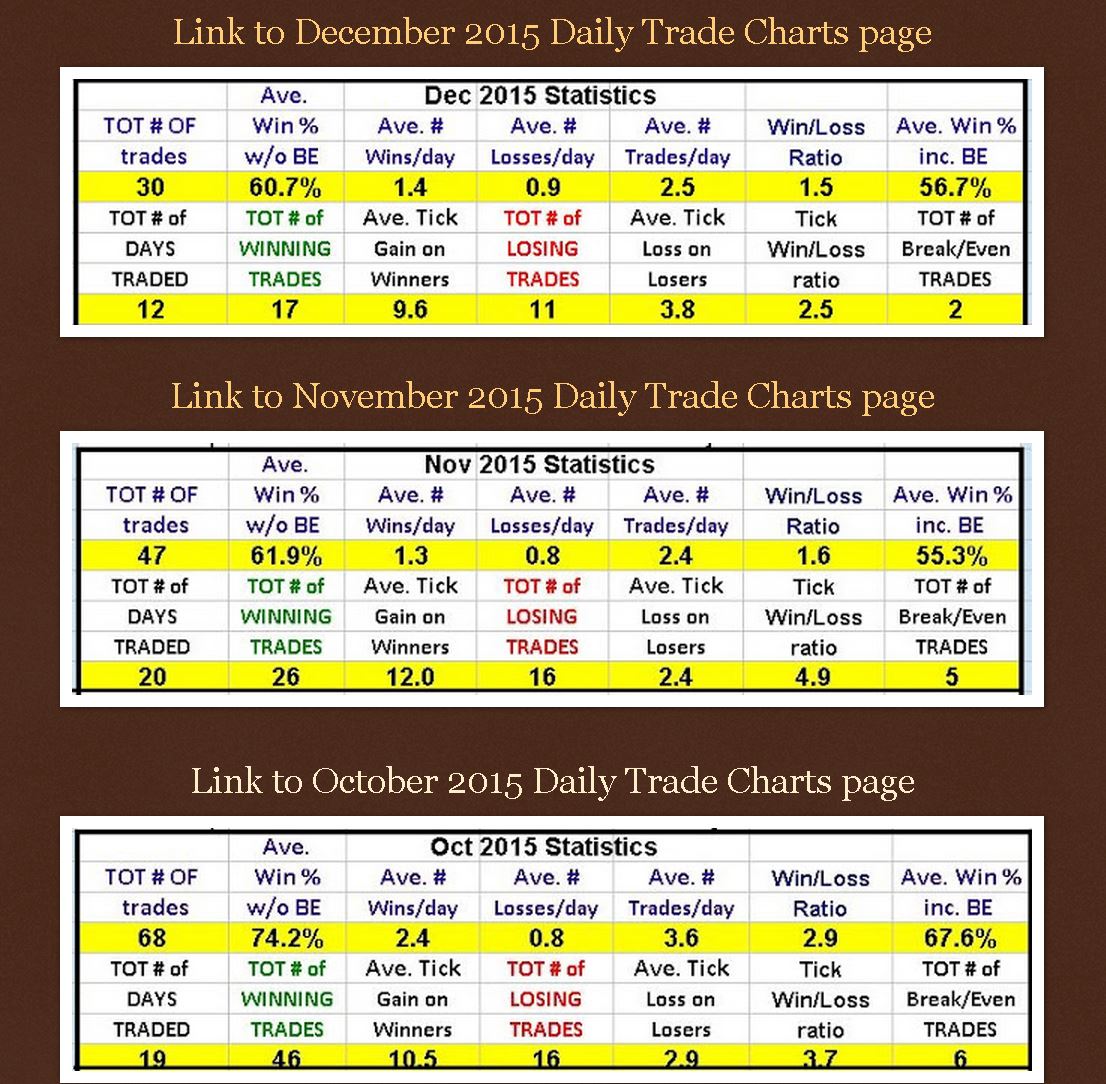
over the years - my running win-to-loss ratio is between 54% to 58+% (cumulative year-to-year) which includes break even trades...
(I include break-even trades in the loss column)
I keep statistics on a monthly basis as well as on a cumulative yearly basis.
I also keep track of all my stats without including BE trades as losses - those numbers are currently averaging 60%+ (monthly).
The idea is to limit the losses while sill being able to raise the initial stop ASAP
while also enabling the option to increase the target exit of each trade...
I do not always wait for my initial stop or target areas to be reached before closing positions:
My running average for winning trades is +9.6 tick per and losing trades is -3.8 tick.
I do have to withstand a lot of stop-outs below my entry area (3 tick, 2 tick, 1 tick and BE)
while also allowing for the opportunity for greater than 10 tick trades.
My methods are discretionary in nature and are based on my personal results.
A lot of my success depends on "feel for the trade" experience which is harder to explain
than are the constantly repeating price action patterns and signals I'm presenting.
Examples of some the month-to-month statistics I keep:
REVERSALS RULE !
Swing trades can also be effectively taken using the same scalping methods that are described above.
Just choose your time frames...Price Action is Price Action no matter the length of time you monitor.
Swing trades can also be effectively taken using the same scalping methods that are described above.
Just choose your time frames...Price Action is Price Action no matter the length of time you monitor.
Emini Day Trading /
Daily Notes /
Forecast /
Economic Events /
Search /
Terms and Conditions /
Disclaimer /
Books /
Online Books /
Site Map /
Contact /
Privacy Policy /
Links /
About /
Day Trading Forum /
Investment Calculators /
Pivot Point Calculator /
Market Profile Generator /
Fibonacci Calculator /
Mailing List /
Advertise Here /
Articles /
Financial Terms /
Brokers /
Software /
Holidays /
Stock Split Calendar /
Mortgage Calculator /
Donate
Copyright © 2004-2023, MyPivots. All rights reserved.
Copyright © 2004-2023, MyPivots. All rights reserved.
