ES Tuesday 9-8-15
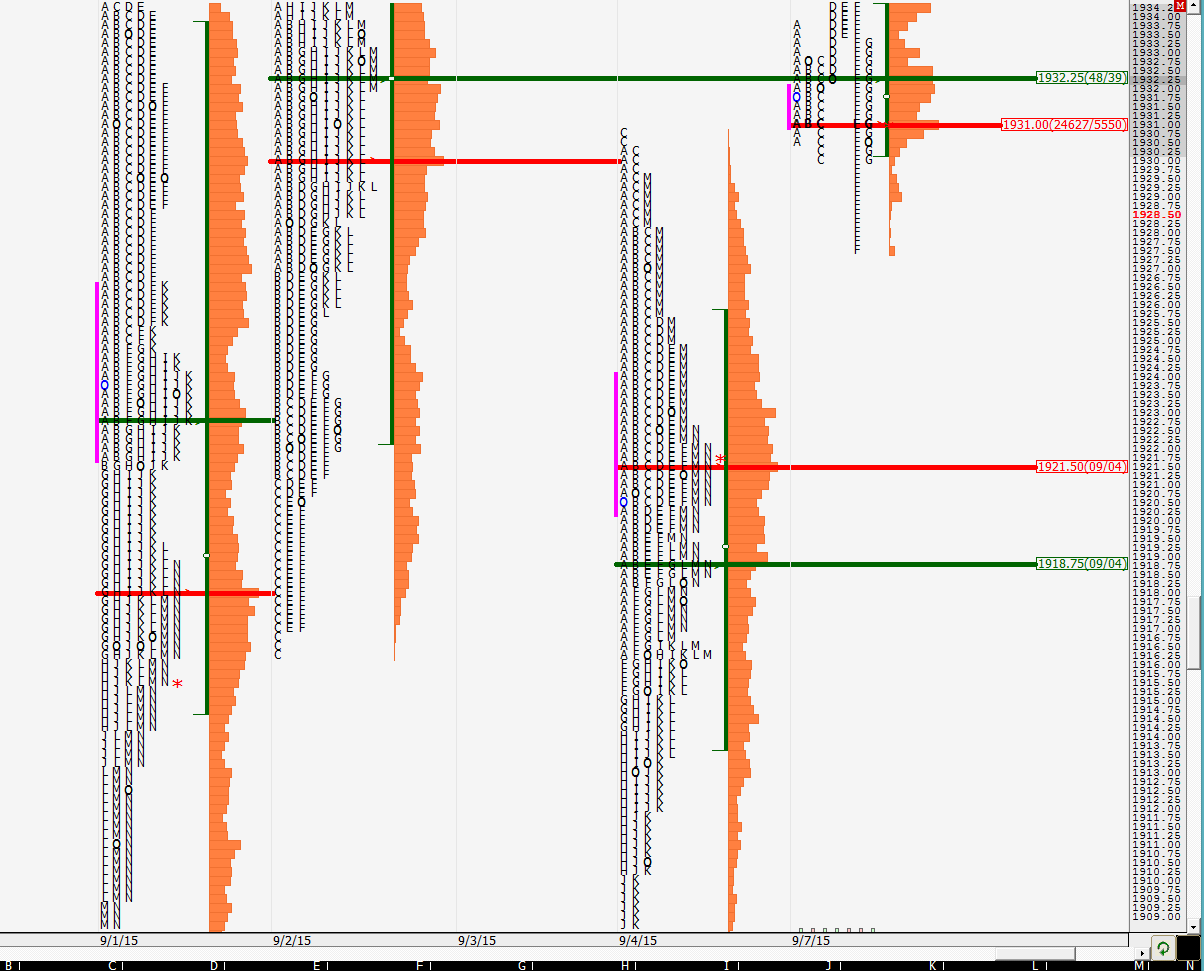
Good morning to all. Since I am running late, I will keep it short and post a few charts. We are in a narrow trading range not knowing whether we made a lower high (1992) or a higher low (1899). That should be our focus for providing us direction and is the ~90 points of range. Right now we are smack in the middle of it.
We are currently opening inside 9/3's range. First picture shows the profile from Friday/Monday and the second one is for 9/3 for reference.
We are currently opening inside 9/3's range. First picture shows the profile from Friday/Monday and the second one is for 9/3 for reference.
Greenies: 1894, 1923.25, 1951.25, 1965.5, 1979, 1995, 2014.25, 2053.25, 2077.75
with China risk diminishing, cud easily travel 2030-2050 this week.
Sold 1966 on a position trade looking for amove backdown some .. The chart maintains a positive posture, but is overbought.
Originally posted by koolblue
Sold 1966 on a position trade looking for amove backdown some .. The chart maintains a positive posture, but is overbought.
kool, what is your time frame on the position trade? multiple days? or shorter? i see that you have a 3-min chart here
yeah, only because i showed the 30 min chart late yesterday. i know most are daytrading. My position trades are generally 1-3 days
that is interesting to know. i have a couple of questions.
if i may ask, what is your target and stop? i have not traded this long of a time frame so am curious. thanks again for the explanation.
also what made you change your time frame from day trading to short term? time commitments, etc?
if i may ask, what is your target and stop? i have not traded this long of a time frame so am curious. thanks again for the explanation.
also what made you change your time frame from day trading to short term? time commitments, etc?
Originally posted by koolblue
yeah, only because i showed the 30 min chart late yesterday. i know most are daytrading. My position trades are generally 1-3 days
First , for the past 3 months i have used a pat 10 point stop when opening a trade , rarely do i let it go the full ten. Only once so far. This trade ,since the 30 min chart and the short term 3 min chart were both very bullish ( with prc bands pointing up, avgs positve with red over black , and price action positve) i exited at 1972 for a 3500 dollar loss. Winners range from 5 to 20 thousand. Cycles point to a top tomorrow , so i will look for selling oppurtunities soon.
Emini Day Trading /
Daily Notes /
Forecast /
Economic Events /
Search /
Terms and Conditions /
Disclaimer /
Books /
Online Books /
Site Map /
Contact /
Privacy Policy /
Links /
About /
Day Trading Forum /
Investment Calculators /
Pivot Point Calculator /
Market Profile Generator /
Fibonacci Calculator /
Mailing List /
Advertise Here /
Articles /
Financial Terms /
Brokers /
Software /
Holidays /
Stock Split Calendar /
Mortgage Calculator /
Donate
Copyright © 2004-2023, MyPivots. All rights reserved.
Copyright © 2004-2023, MyPivots. All rights reserved.


