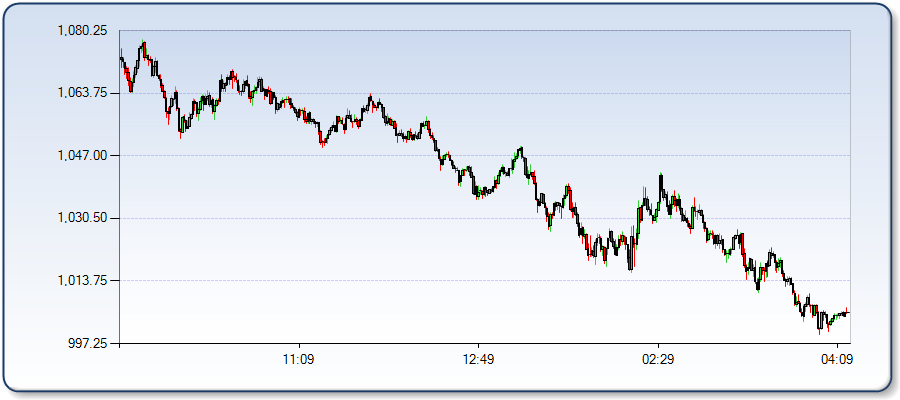
ES Monday 8-24-15
Good morning to all. I will not be having any charts today as we are in uncharted territory. Between Thursday and Friday, the markets were down >5% and as of right now, we would be opening down another -3%. This is almost a once in a lifetime-esqe market and common sense has been thrown out the window. It appears that there is sheer panic in the market and no greenie, trnedline, MP reference, Fib number, etc is standing in the way. If you have been short the last 2 trading days, you would have made a good year's amount in it. If you were long and not at all nimble, you have been burned. Until we see some correction of inventory, it is a fool's errand to guess a turning point for this market. There is a very real possibility that we could be limit down today (I read someplace that it would happen at 1870). I would strongly suggest to sit out this market unless you feel very strongly that you can trade it.
Unfortunately I am in the camp that lost their shirt on this move down. Since Thursday I have seen a huge draw down on my account and unless things turn around today, I am in deep trouble. Goes to show you that you can analyse the heck out of the market but if your execution is not on point, you are screwed. I have been getting away with this until now but this almost unprecedented market has exposed me for my shortcomings. At this point my account is on life support.
Let us see what happens today. Everything on the inventory side is just super short and we have not had any correction for the past couple of days. Let us see if that happens today or if we limit down.
Good luck to all and stay safe out there.
limit down hit.....this is just mind boggling to me... DT, do you have any historical comparison to price action since Thursday?
this is off my memory.. the 1 st time sp cross 1500..it went to i think 1535 and crash 100 points in one day( i wish i could remember the year)..i believe back then there was no limit for the day..just like my trading i could wrong.
take care
duck
take care
duck
the year was 2000 newkid
thanks duck...
the first min was one of those out of body experiences
current range of first 30 mins is 73.75 points
Originally posted by NewKid
limit down hit.....this is just mind boggling to me... DT, do you have any historical comparison to price action since Thursday?
Not to hand. It would take me a fair amount of time to mine that information.
no problem. thanks for answering.
NewKid, if you go to http://www.mypivots.com/chart and put in:
From: 10/07/2008 09:30
To: 10/07/2008 16:15
and then click Submit it will pop up a chart that looks like this which was also a big down day:
Now click on the Accumulate check-box and mark that as checked. Click on the From date on the calendar and change it to the next trading day (leaving the time as it is). Do the same for the To date. Now click Submit. It will stack each day's chart on that page so you can see each of the time-frames that you've picked. See if you can find a day that looks like today. Hunting around Sep, Oct, Nov 2008 will probably yield the best results.
If you find a good chart then right click on the image, save to disk, and post in here.
Emini Day Trading /
Daily Notes /
Forecast /
Economic Events /
Search /
Terms and Conditions /
Disclaimer /
Books /
Online Books /
Site Map /
Contact /
Privacy Policy /
Links /
About /
Day Trading Forum /
Investment Calculators /
Pivot Point Calculator /
Market Profile Generator /
Fibonacci Calculator /
Mailing List /
Advertise Here /
Articles /
Financial Terms /
Brokers /
Software /
Holidays /
Stock Split Calendar /
Mortgage Calculator /
Donate
Copyright © 2004-2023, MyPivots. All rights reserved.
Copyright © 2004-2023, MyPivots. All rights reserved.
