ES Wednesday 8-19-15
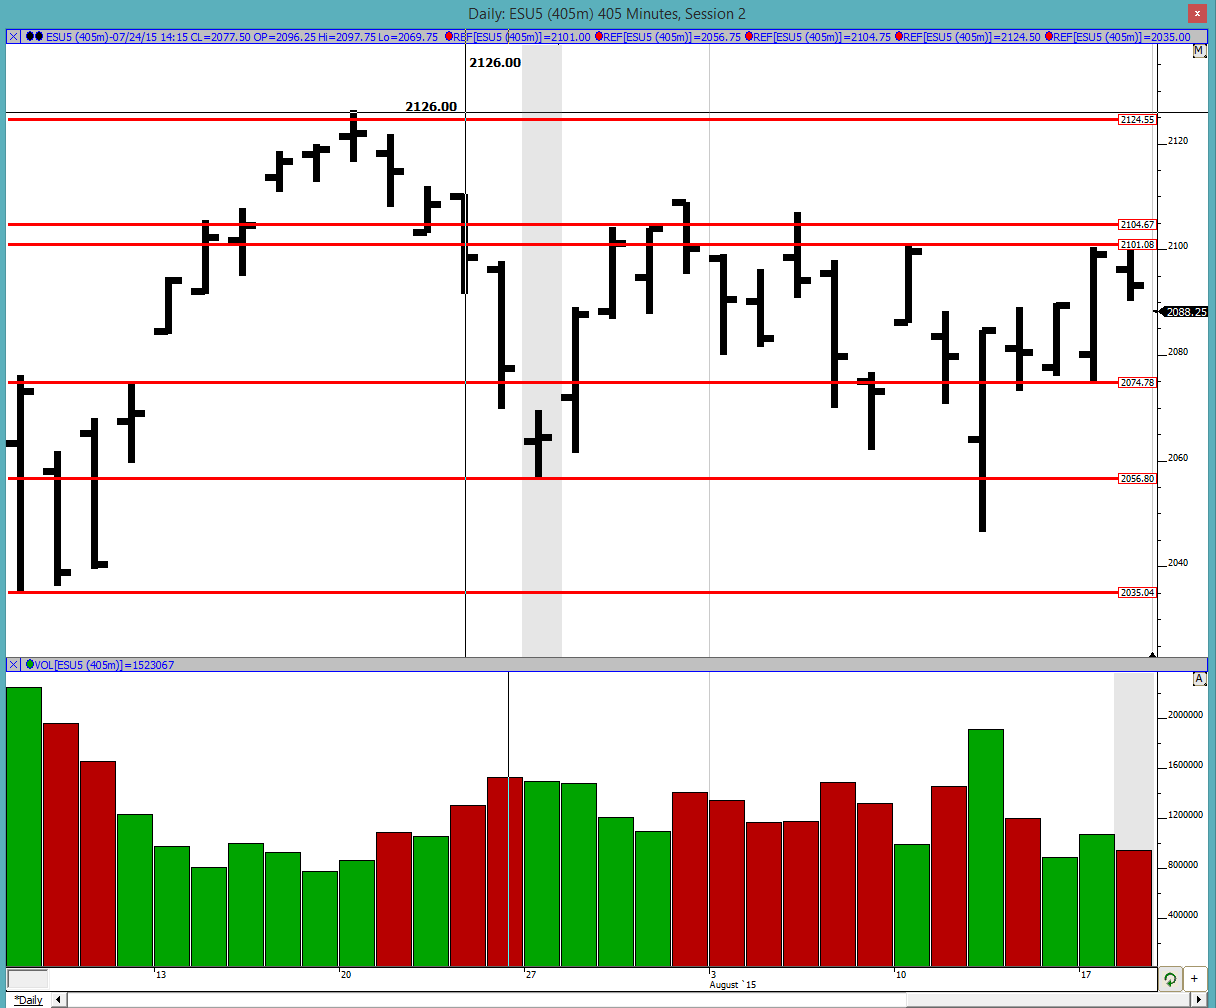
Good morning to all. Tuesday was an inside day on the upper side of Monday. This could have been just digesting Monday's move and/or in anticipation of today's FOMC minutes. Look for a break out of 2101 or an approach to 2074.75. After an inside bar we should be on the lookout for a break out of the inside bar or a fake-out.
Greenies (past naked developing VPOCs): 2051.5, 2053.75, 2094.5, 2097, 2104.25, 2112.75, 2118.75 and 2123.5
Profile:
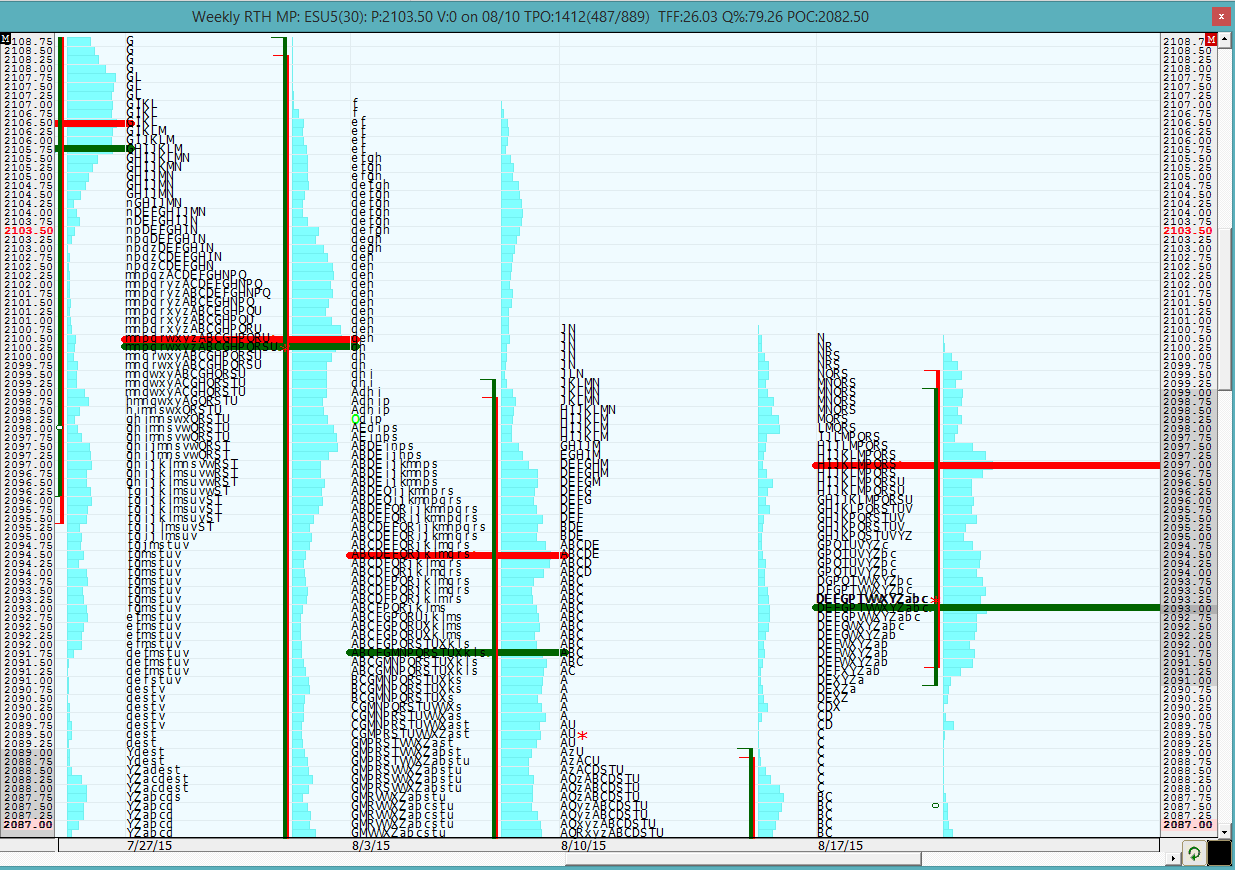
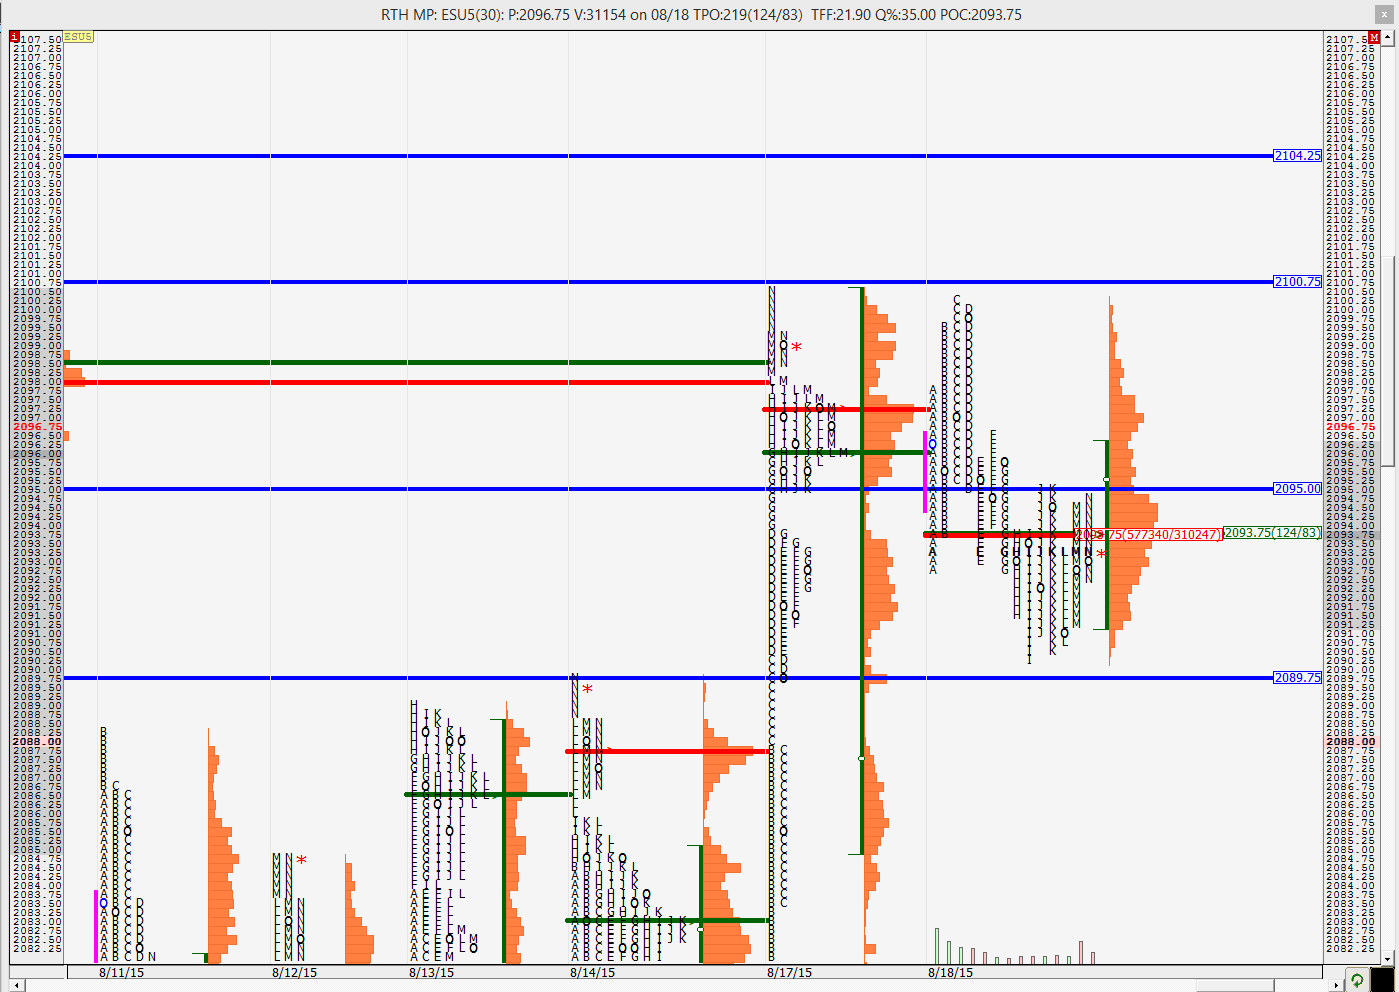
Tuesday had both it's POC and VPOC at 2093.75. The POC was fairly prominent and with the VPOC being there too, it increases the odds of it being revisited. We see that YD had both poor highs and poor lows with only 1 tick of excess on both ends. We also see how the low came within a couple of ticks of the previous balance area high of 2089.75. Also the high came within 2 ticks of 8/17's high which was 1 tick shy of 8/10's high. Very mechanical selling and looks like folks with deep pockets who could be short term traders are selling there and looking for 2074.75 and/or 2056.75. This would mean that there are a lot of stops above these highs so look out for that.
Below is a weekly MP chart for RTH only sessions. Here again we see those poor highs mentioned earlier.
On the split profile we can see how the E period high (which is 2096.5), J,K and N period highs (2094.75/2095) are the lines in the sand. They are also YD's RTH mid-pt. So these are points at which sellers could come in and pause the market. These are the lines in sand for today with respect to YD.
The O/N inventory looks more short than long so look out for some likely short covering at the open. As of right now we would be opening outside YD's range so possible points where sellers could come in are YD's low (2090.25) and the lines in sand mentioned earlier.
FOMC minutes are being released today at 2pm EST so markets could be muted before then so we could have a slow morning.
Good luck trading to all.
the last single prints from 8/17 are now filled
so far no attempt has been made to close the gap
this is a lot of single prints in the first 30-min period and we are only 18 minutes into it
current low is 1 tick above 8/17's low... weak buying but it could stand for some time due to the sheer number of prints so far
all of Monday's gains have now been wiped out and we start over.... this trading range is now driving me a little crazy
30 min VPOC at 2077.5
yet another poor low.... current low is 2 TPOs wide
will we enter the 1-min OR and close the gap?
i misread the chart. it matches the 8/17 low to the tick
Originally posted by NewKid
current low is 1 tick above 8/17's low... weak buying but it could stand for some time due to the sheer number of prints so far
the poor low is now cleaned up and we are making new lows
we hit YD's VPOC and retraced.
Emini Day Trading /
Daily Notes /
Forecast /
Economic Events /
Search /
Terms and Conditions /
Disclaimer /
Books /
Online Books /
Site Map /
Contact /
Privacy Policy /
Links /
About /
Day Trading Forum /
Investment Calculators /
Pivot Point Calculator /
Market Profile Generator /
Fibonacci Calculator /
Mailing List /
Advertise Here /
Articles /
Financial Terms /
Brokers /
Software /
Holidays /
Stock Split Calendar /
Mortgage Calculator /
Donate
Copyright © 2004-2023, MyPivots. All rights reserved.
Copyright © 2004-2023, MyPivots. All rights reserved.


