ES Tuesday 8-11-15
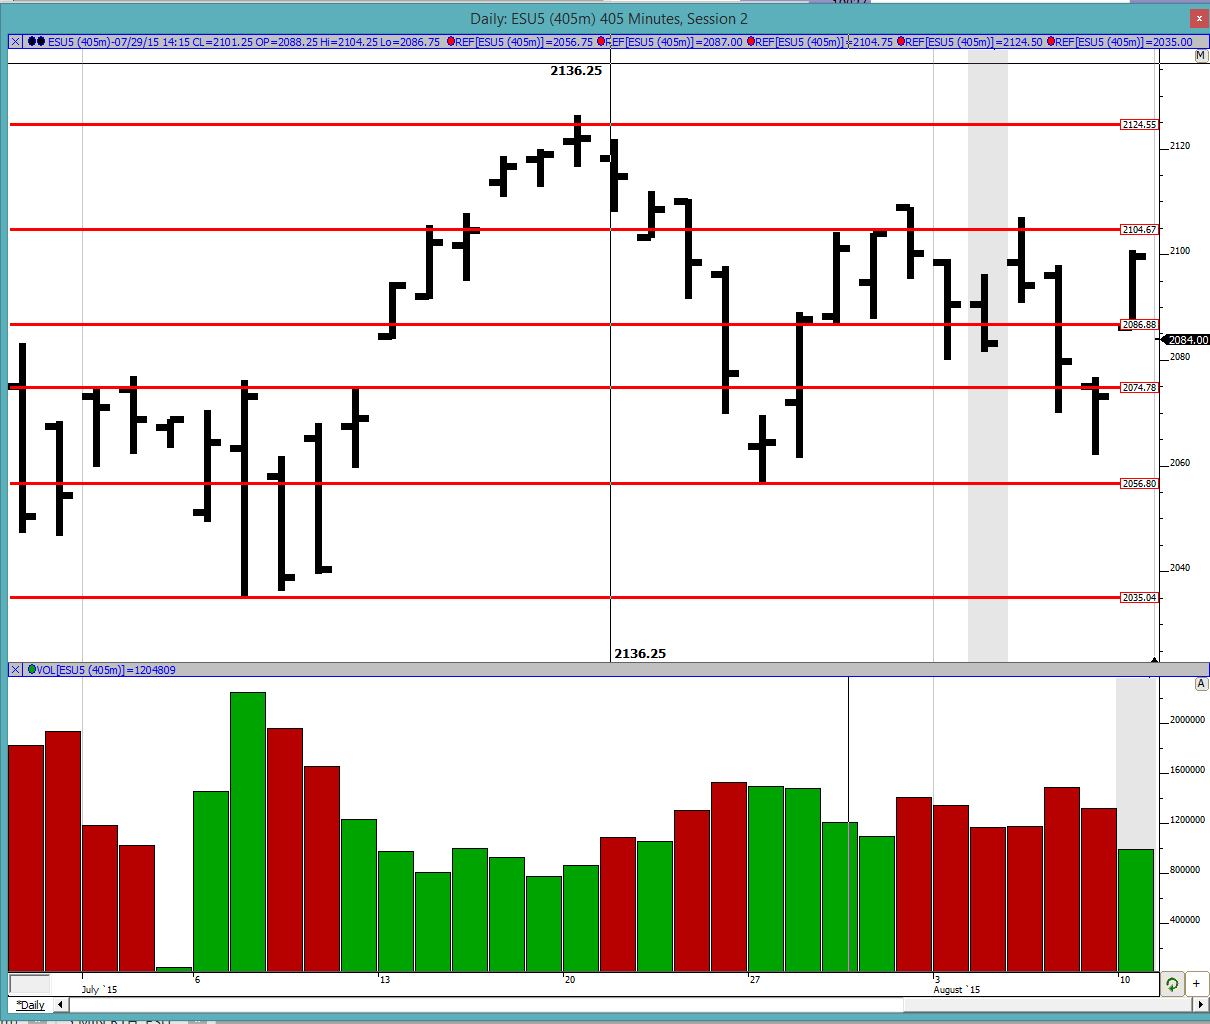
Good morning to all. The market has been in a relatively narrow trading range for some time now and we are still in the middle of it. Note how it did break through the 2074.75 level but failed to close too far below it inspite of exploring prices far below that level. The buyers seem to be defending that level for now. Keep the profile references in mind as we move forward to provide us with a guide on general direction.
Greenies: 2065.5, 2073.5, 2077, 2090.25, 2092.75, 2096.75, 2098, 2104.25, 2112.75, 2118.75 and 2123.5
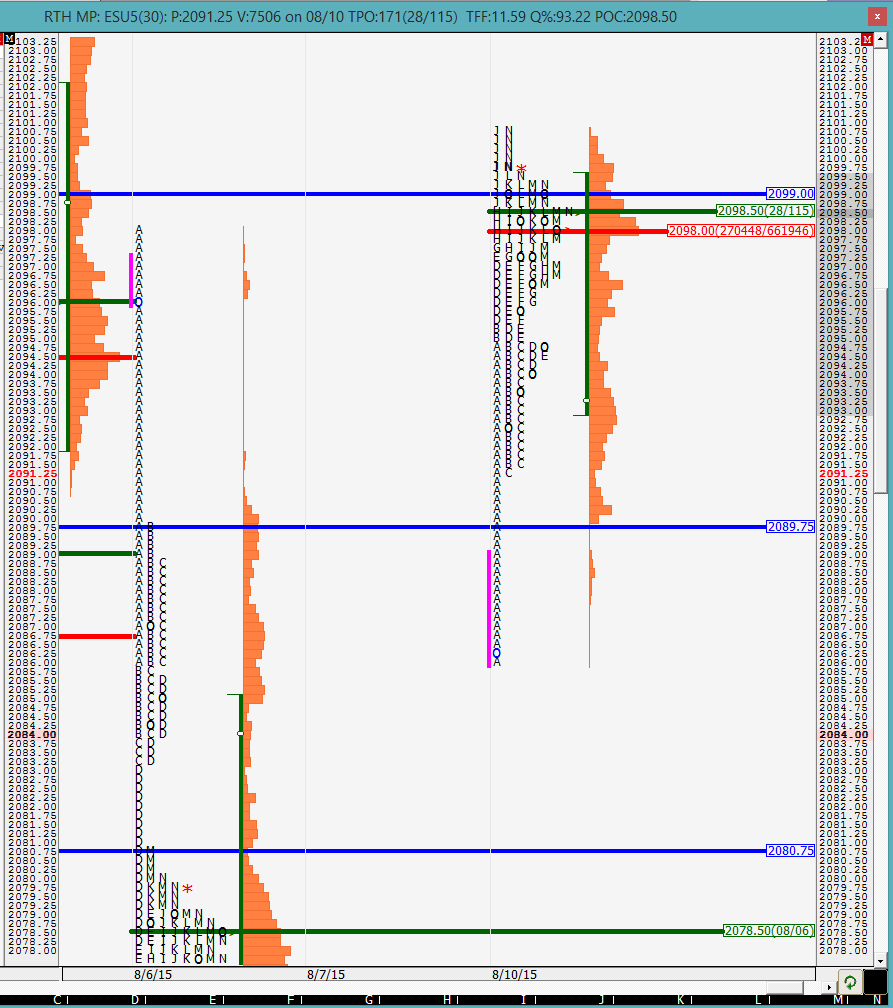
Profile: Monday was almost a P shaped profile with what looked like a large short covering rally. We can see the single prints in the A period which is usually pretty typical of a short covering rally and then not much of a move upwards. I am noting that the high was a poor high with no excess. Both the VPOC and POC on the day were closer to the highs and that combined with the poor high indicated that the market was not done doing business up there.
The split profile also shows the short covering nature of the day. The market shoots up at the open and then just meanders around. There were no real significant pullbacks during the day with the market just grinding up after the shooting open.
With the overnight news on China devaluing the yuan the markets are down quite a bit this morning. I would say that the O/N inventory is almost 100% short. The question is how does the market react on open? Will it care or resume its business above Monday's close. As of now we would be opening the gap between 8/7 and 8/10 so really not sure what to make of it. It will be interesting to see if we have another short covering rally at the open for the O/N shorts or if more sellers are going to pile on.
Good luck trading to all. I will be around for a couple of hours this morning before taking off to cater to my other business.
market is now approaching YD's range. Let us see if we can get back in range or if it is rejected. this could very well be just O/N inventory adjustment
weak sellers selling right at YD's low. very mechanical.... current high matches YD low
the high of the day is now corrected... such mechanical buying/selling usually does not hold because they are usually scalpers who bail very very quickly
so far YD's range has been rejected. market is looking weak right now unless it can get back into YD's range and build value there
30 min VPOC at 2084.75. The market looks rather indecisive right now
so far we are still fully within the A period again emphasizing the indecisiveness of the market. look for the coil to unwind
Don't forget weekly profiles
last week's VAL is 2075.25
last week's Volume VAL is 2074.25
these are usually popular bounce points when tested Monday or Tuesday of a week.
(VAL's above generated with SIerra Chart, might differ slightly from MD generated data)
last week's VAL is 2075.25
last week's Volume VAL is 2074.25
these are usually popular bounce points when tested Monday or Tuesday of a week.
(VAL's above generated with SIerra Chart, might differ slightly from MD generated data)
good point Paul. Thanks for the reminder. I need to start monitoring these levels again!
Emini Day Trading /
Daily Notes /
Forecast /
Economic Events /
Search /
Terms and Conditions /
Disclaimer /
Books /
Online Books /
Site Map /
Contact /
Privacy Policy /
Links /
About /
Day Trading Forum /
Investment Calculators /
Pivot Point Calculator /
Market Profile Generator /
Fibonacci Calculator /
Mailing List /
Advertise Here /
Articles /
Financial Terms /
Brokers /
Software /
Holidays /
Stock Split Calendar /
Mortgage Calculator /
Donate
Copyright © 2004-2023, MyPivots. All rights reserved.
Copyright © 2004-2023, MyPivots. All rights reserved.

