ES Tuesday 7-28-15
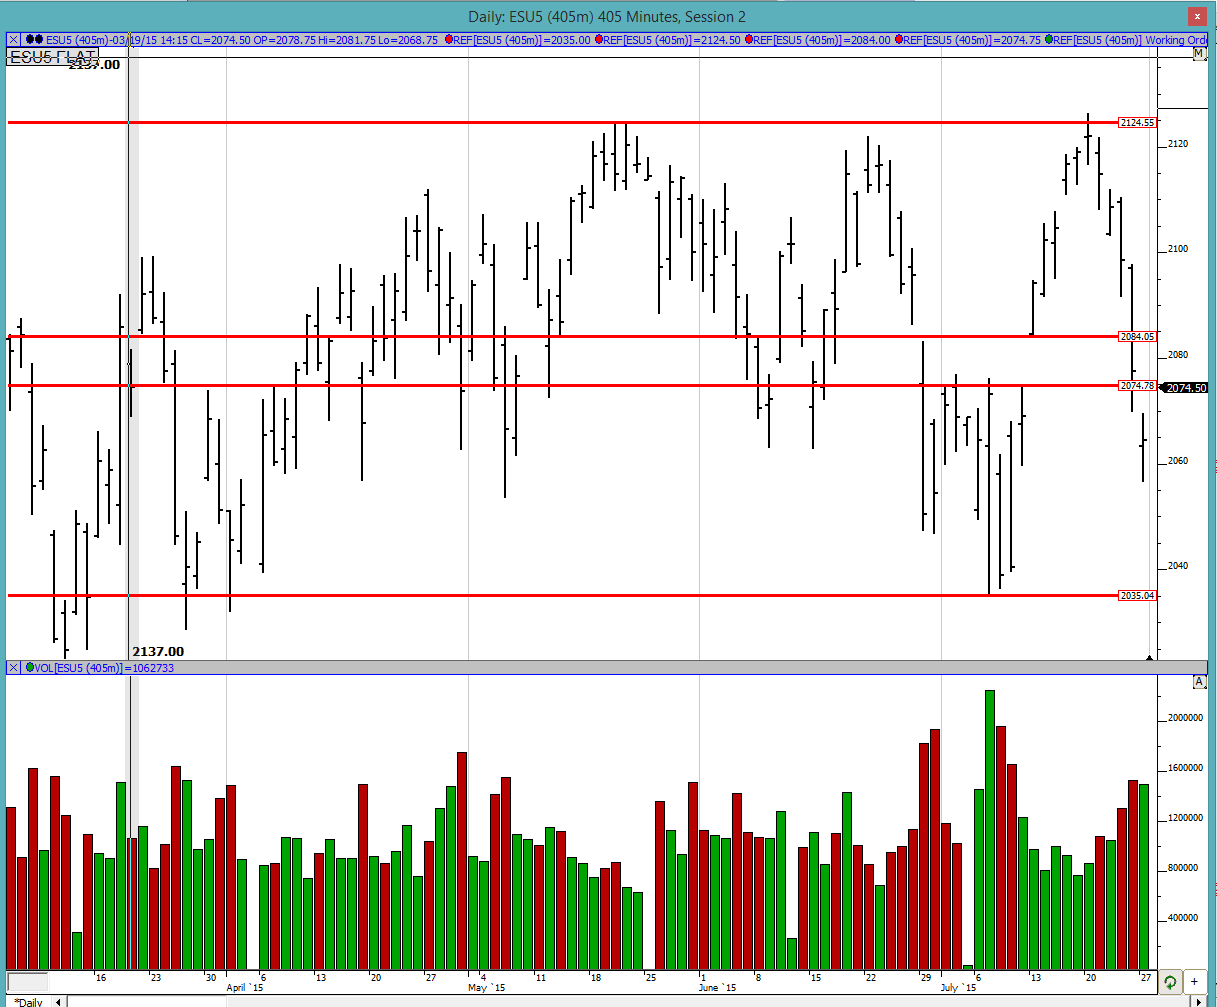
Good morning to all. The past few days have seen a lot of selling/liquidation in the market as evidenced by the chart below. The next downside target is still in the 2035/2040 area as noted by the lowest line but at this point one would imagine that the market has to pause, right? The move up to all time highs was relentless and so has the move down been. We definitely seem range bound over here.
Greenies: YD was a great example how the greenie provided support after the gap down and screeching down move on the open. On the upside we have greenies at 2073.5, 2087.75 and 2092.75. On the lower side we have greenies at 2062.25, 2051.5/2050.5 and then thats it.
Profile:
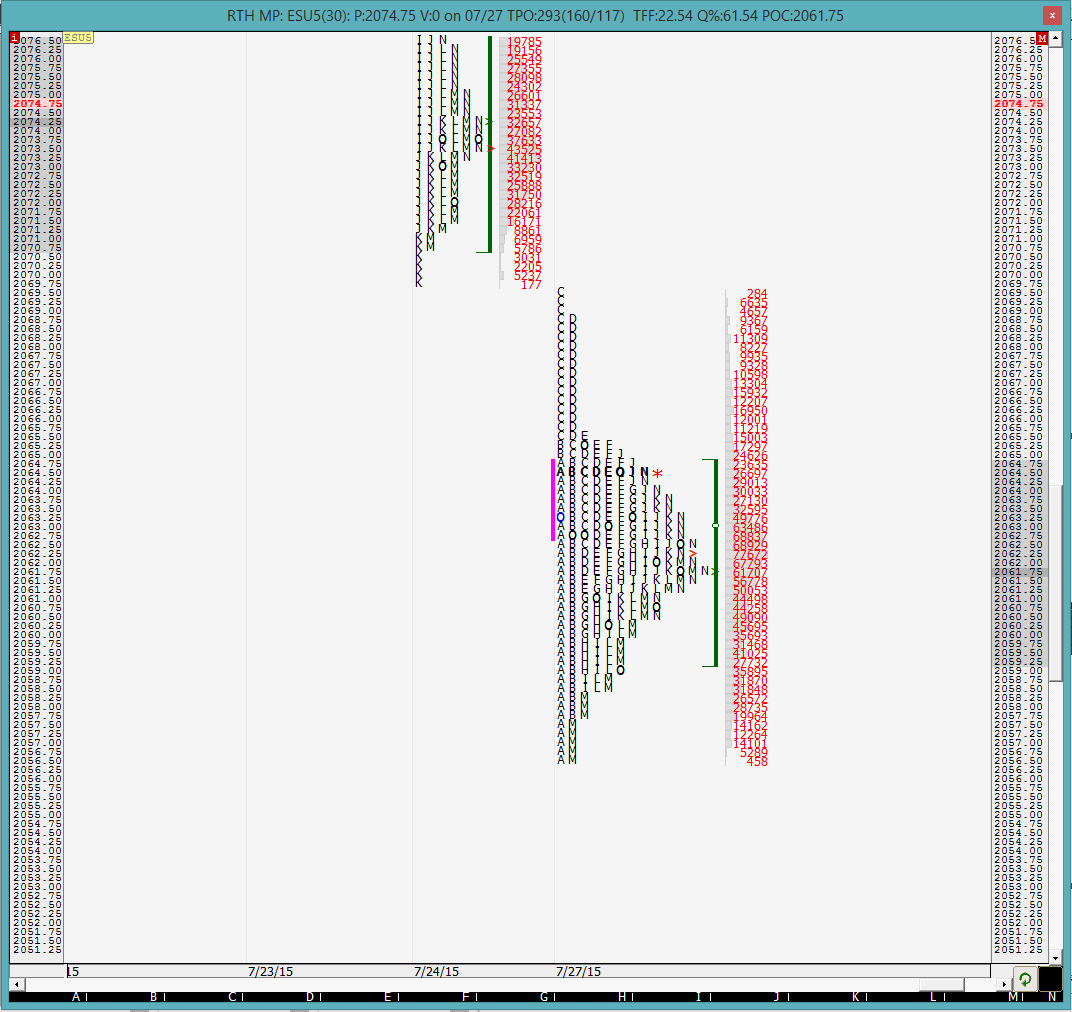
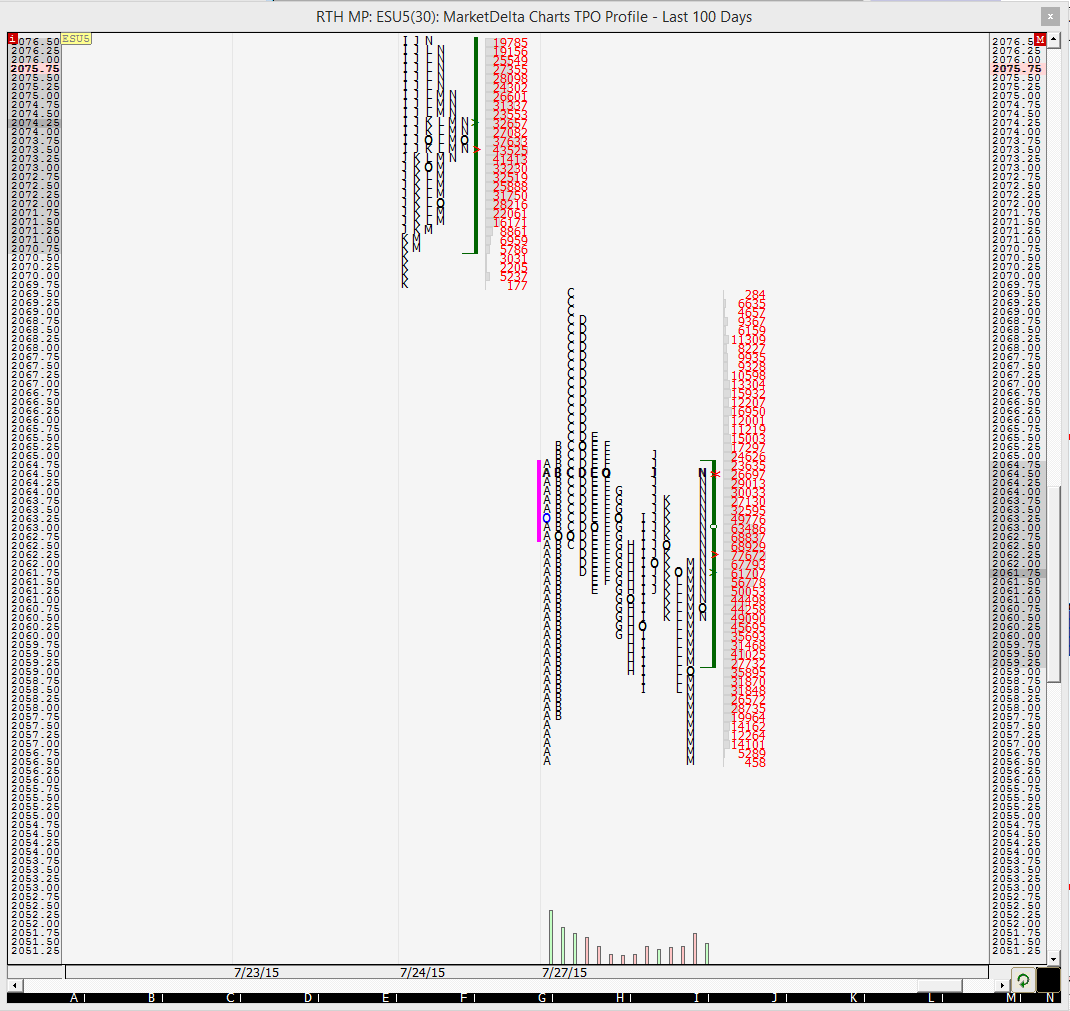
Another day with a not so pretty profile. The high of the day can be considered weak because it came right up to the low of 7/24 and brought in the day time frame sellers again. The low is obviously poor due to lack of excess with day time frame buyers coming in right at the low of the day. There is a very prominent POC at 2061.75 which means that it will be revisited at some point in the future. The value on the day was clearly lower due to the large gap down but it was primarily a balancing day as evidenced by the prominent POC. Was this the balancing day before a short covering rally? We shall see.
On the split profile we can clearly see the poor low and the weak high. We can also see the typical behavior on a balancing day where the market kept trying to sell off in the G. H, I, L and M periods but kept coming back to the POC. The POC becomes like a magnet and as sellers continued to sell every rally in the day but when they failed to get paid, they threw in the towel at the end of the day resulting in a small short covering rally late in the M period and continuing in the N period to close much higher. This is pretty typical behavior.
The O/N action has been almost 100% long. We did not get the O/N mid-pt test YD in RTH session so the odds are higher that we get that test today. On the other hand, the O/N action might force some shorts to start covering at the open which could push the market still further higher at the open. It should be a battle at the open so worth watching a little at the start before jumping in.
Good luck to all.
we have bounced off of 63.5 twice (the B period low) and the A period low is right on the ONL as well as at YD's RTH mid-pt. Looks like weak buying but is this actionable information?
Ha. apparently so. we just took out that low and finally hit the VPOC from YD and are very close to the prominent POC.
Since it appears no one else is around and I think I am done trading for the day, I will be back tomorrow.
Good day and good luck to all readers!
Since it appears no one else is around and I think I am done trading for the day, I will be back tomorrow.
Good day and good luck to all readers!
Emini Day Trading /
Daily Notes /
Forecast /
Economic Events /
Search /
Terms and Conditions /
Disclaimer /
Books /
Online Books /
Site Map /
Contact /
Privacy Policy /
Links /
About /
Day Trading Forum /
Investment Calculators /
Pivot Point Calculator /
Market Profile Generator /
Fibonacci Calculator /
Mailing List /
Advertise Here /
Articles /
Financial Terms /
Brokers /
Software /
Holidays /
Stock Split Calendar /
Mortgage Calculator /
Donate
Copyright © 2004-2023, MyPivots. All rights reserved.
Copyright © 2004-2023, MyPivots. All rights reserved.


