ES Monday 7-27-15
Good morning to all. The past week has been quite a crazy one indeed with all the selling so the upcoming week should be interesting as always.
Let us start with the daily chart seen below. We can see that there was a massive sell off on Friday that closed the gap mentioned earlier and still noted on the chart. They did not hesitate a whole lot on the selling. Next if the selling were to continue, all I can see on the downside is 2035 which was the swing low prior to the last move up. Do we go down there or have a short covering rally/defending by the buyers? I think next week we should see whether the shorts are forced to cover or not.
Greenies: The next greenie up is at 2087.75 and at 2092.75. On the downside we have one at 2073.5 (from the close on Friday), 2068.5 (debatable greenie) and then at 2057.75. Looks pretty thin on the downside after that gap close. So Monday's action is going to be crucial on where that line in sand is drawn.
Profile:
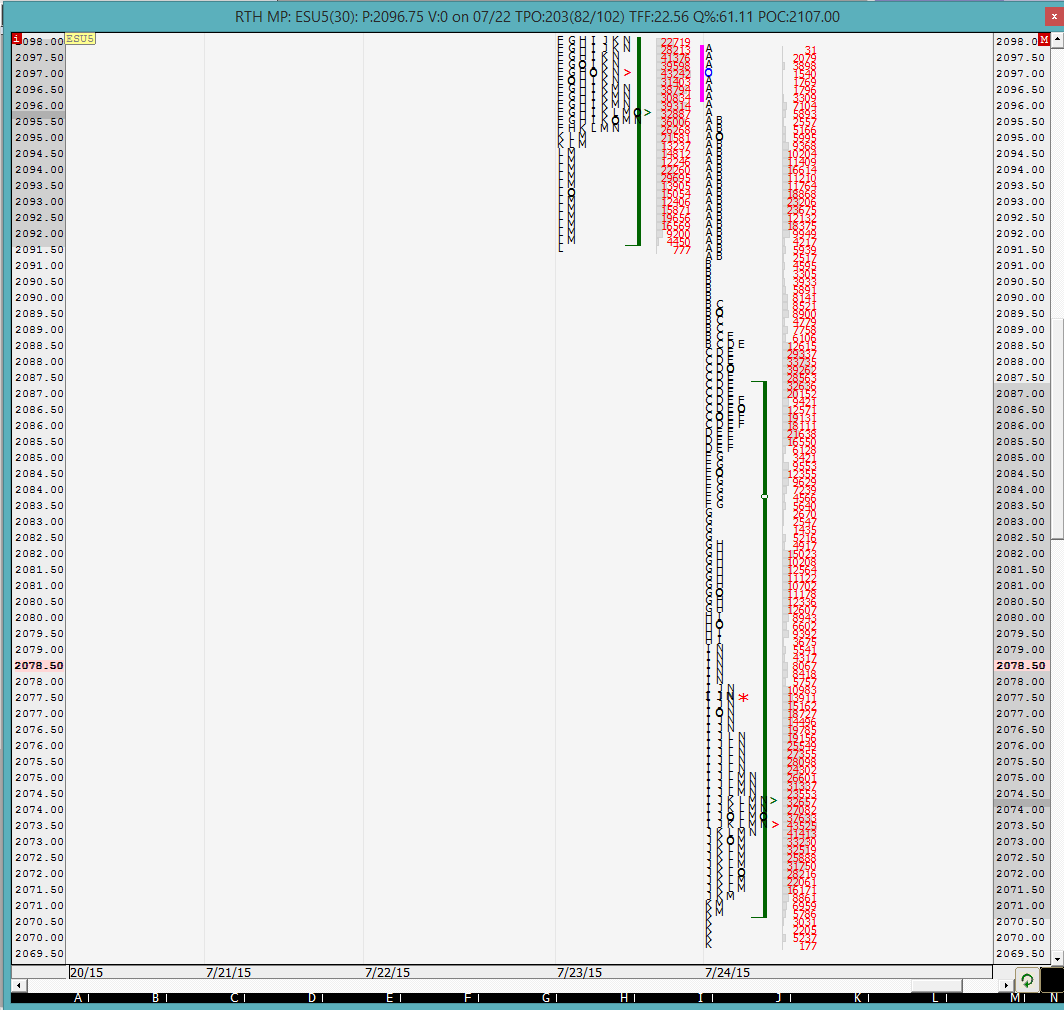
MP chart is pasted below. I had a hard time making it fit on the screen! How is that for an ugly profile. We can see 3 distributions with single prints galore. The POC was not very wide and that with the VPOC were below the close. I am not really sure what to make of this except to say that at some point we should expect those single prints to be cleaned up.
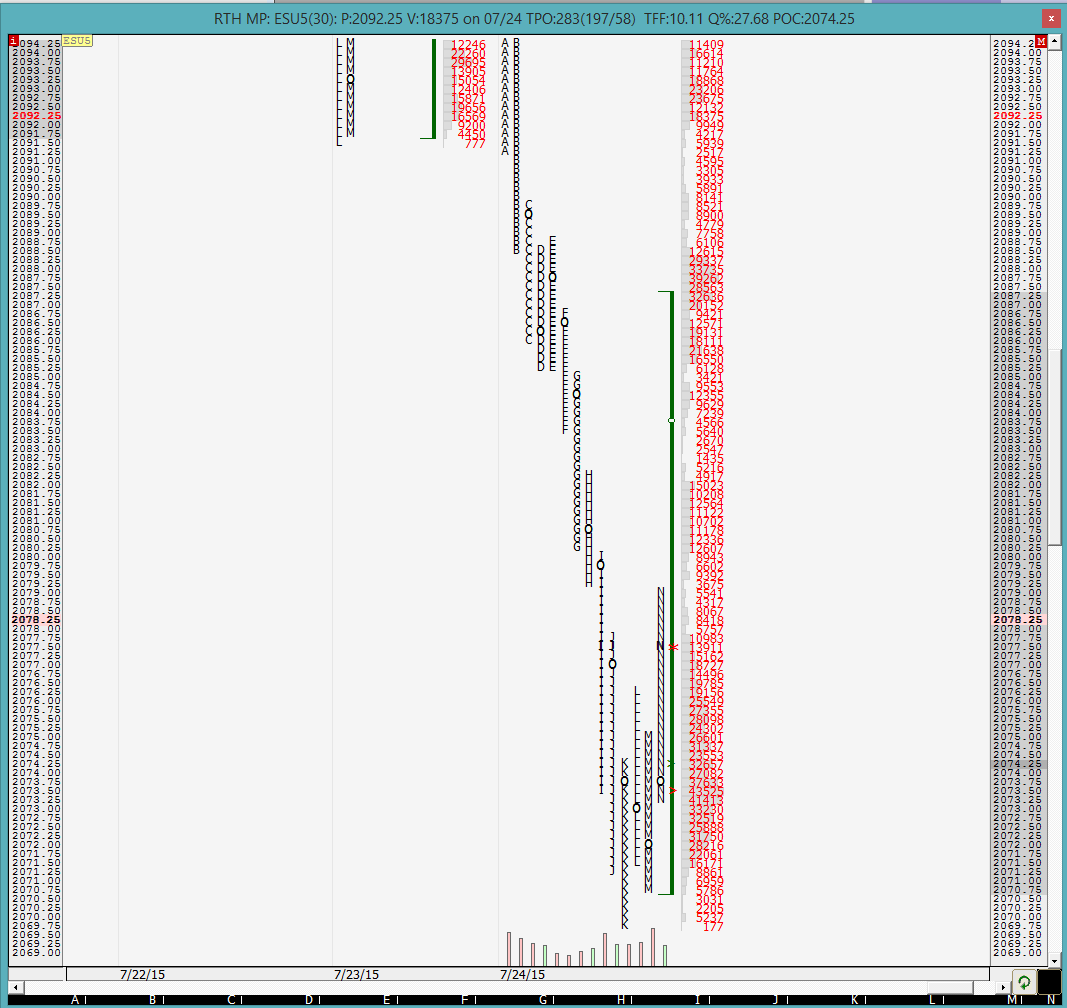
Split profile chart is pasted below. We can see that the H period high could not take out all the single prints from the G period leaving behind single prints. So that is where we can expect the sellers to first show some resistance in the 2082.25 area. After that it is the C period high which left single prints in the B area which would be the next area where sellers could potentially come in to defend. Again, this is an ugly profile.
It should be interesting to see how the O/N plays out and where we open on Monday. In which of the 3 distributions from Friday we open in will dictate the rest of the day to a certain degree. Opening in the middle distribution would be a neutral to a positive direction and the lowest distribution with not much upside movement would mean more bearish action.
One last note on the shape of the profile. From what Dalton has said and is reiterated by the ShadowTrader, such profiles indicate that the action was mainly liquidation and not much of new money selling. So that is why Monday's action will be important to see whether the buyers think that these are bargain prices and step back in or are the sellers going to drive us 2035 and possibly lower.
I will be back in the AM with a note on the O/N action and a possible trading plan.
Good luck to all.
The O/N inventory is short not 100%. As of now we would be opening outside Friday's range. We shall see if there is any short covering rally today or if the sellers continue to pile on and push us lower. Currently the O/N mid-pt is at 2072.5
Good luck to all
Good luck to all
looks like the sell-off continues as we get to the 2057.75 greenie. lets see what happens here
seeing a bounce off of the greenie so far. next question is if we will go above the opening 1-min IB high and close the gap or will the sellers reappear?
30 min VPOC at 2058
trying once again to get over that 1-min IB high and push into the gap. we shall see if they succeed
attempt to close the gap has commenced... we shall see if they succeed and then manage to get into YD's range. Remember that gaps are treated like single prints
sucked back out of the gap. indifference ensues
current high of the day is 1 tick short of YD's lows. Sellers came in to defend that low at an exact price = weak high
Emini Day Trading /
Daily Notes /
Forecast /
Economic Events /
Search /
Terms and Conditions /
Disclaimer /
Books /
Online Books /
Site Map /
Contact /
Privacy Policy /
Links /
About /
Day Trading Forum /
Investment Calculators /
Pivot Point Calculator /
Market Profile Generator /
Fibonacci Calculator /
Mailing List /
Advertise Here /
Articles /
Financial Terms /
Brokers /
Software /
Holidays /
Stock Split Calendar /
Mortgage Calculator /
Donate
Copyright © 2004-2023, MyPivots. All rights reserved.
Copyright © 2004-2023, MyPivots. All rights reserved.


