ES Thursday 7-23-15
Today I am trying to have some kind of prep done the previous night so that in the AM I only have to look at the O/N action. So here is the recap/prep....
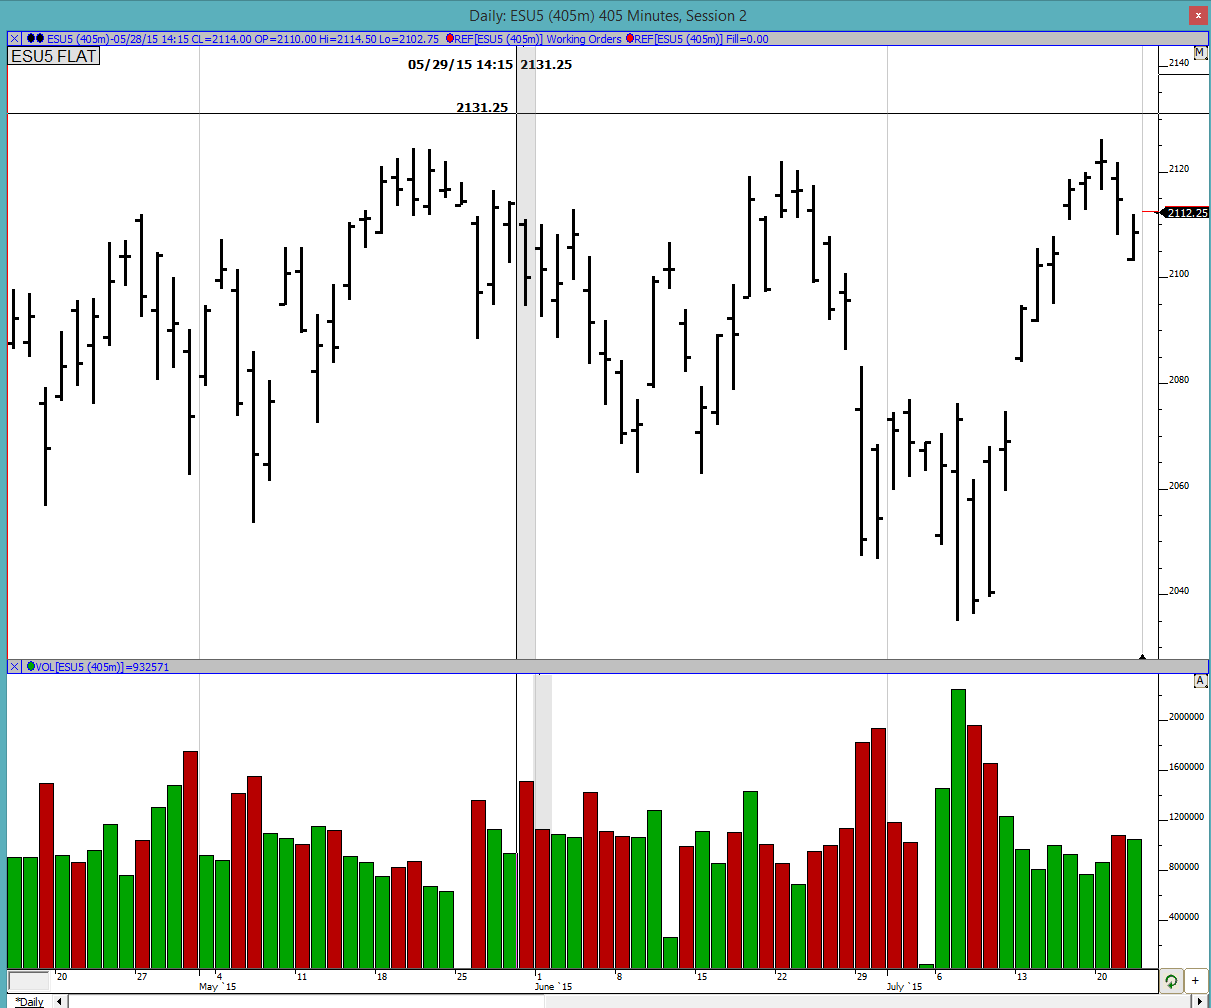
We have now declined for 2 consecutive days after reaching new all time highs. Look at the chart below and you will notice how volume dried up as we approached the new ATH the third time around. That tells me that it was simply day time frame/ short time frame traders who took the market up and now we are correcting again. We need to see wider participation to see continued movement up.
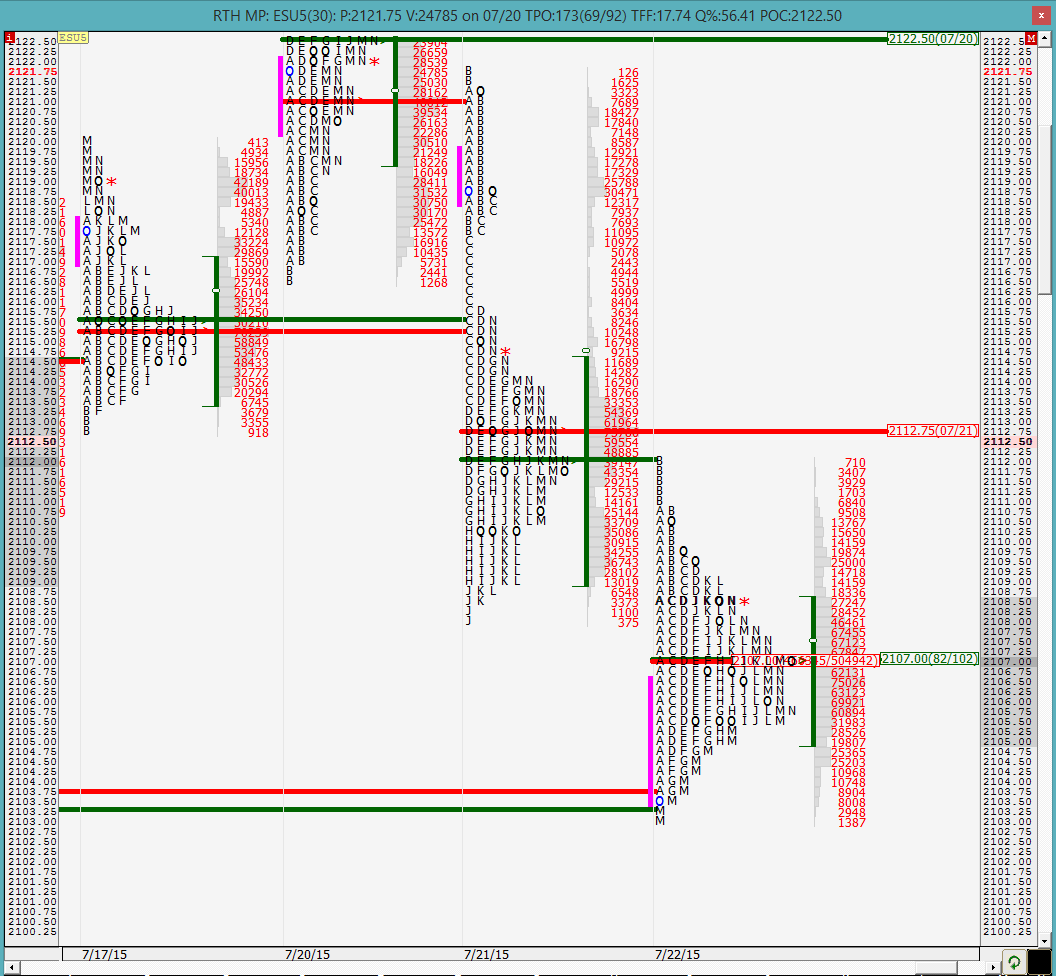
As far as greenies go, we left one behind on 7/22 at 2017 and after that we really do not have any on the downside until 2089 area. There is a small one at 2094.25 but I am not too sure about that. On the upside we have greenies at 2112.75 and then at 2118.75
Profile:
The chart below has the naked POC (solid green lines) and VPOCs (solid red lines) extended out. As we can see that on 7/22 the lows were close to a previous POC and VPOC from 7/15 (the date of 7/15 is not visible on the chart). We can also see a naked VPOC up there at 2112.75 which is the same as the greenie mentioned earlier. 7/22 has its POC and VPOC at the same price of 2107 which is the other greenie mentioned earlier on the downside. Such prominent (read as wide) POCs that are also VPOCs have a very high chance of getting revisited but the million dollar question always is when will that happen? This information needs to be carried forward because it will get revisited at some point.
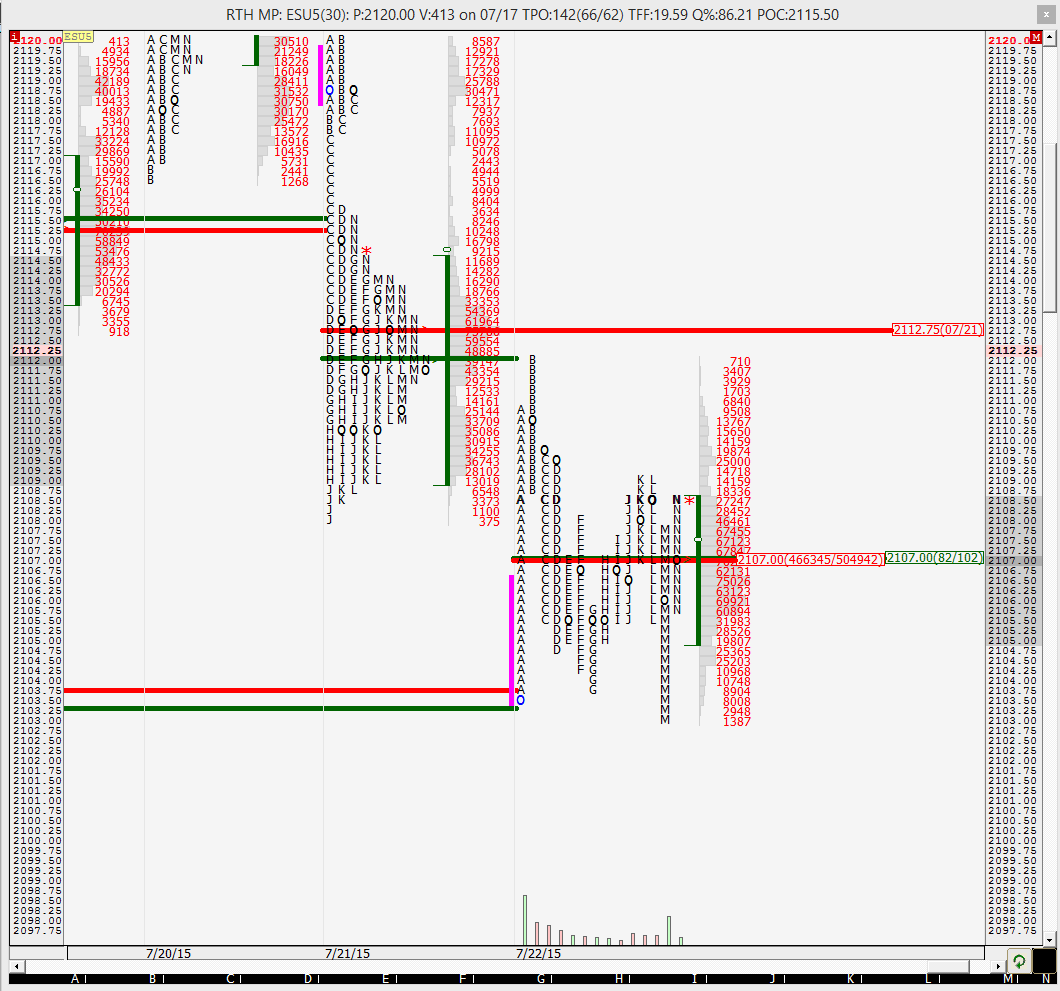
Below is a picture of the profile split up from 7/22. We can see that the B period high (also high of day) was right at POC of 7/21. This implies mechanical selling, a sign of day time frame traders. This indicates there are likely no serious sellers in the market. Just folks yanking things around.
G period low came within 1 tick of the open and there was mechanical buying. Again, day time frame traders blindly buying at the open/low of the day at the time.
It was interesting to me that we did not break either the ONH or ONL on 7/22. I am not sure what to make of that. Maybe Paul has some statistical data on what that means?
Overall value was definitely lower on 7/22 compared to 7/21. Price moved lower but came back up towards the end of the day but value was lower. Another interesting data point.
Will see how the O/N plays out and will have a more clear plan in the AM. Stay tuned for the update!
when market fails to take out the overnight H or L, I consider it kind of coiling as bulls and bears balance in the RTH. It makes a difference whether the Overnight is inside prior day's RTH or outside.
When the overnight is inside the prior day's RTH range, it is definitely building a powder keg... can easily test both (or close to both ends of the O/N riange in the following RTH, and has potential for a breakout and run...
But Yesterday's Overnight had a range that was OUTSIDE the RTH Range... (Tuesday into Wed overnight), and that means new (relatively new) turf for definition of the auction, so it s exploratory by nature, and yesterday might have been a day that saw the bears without sufficient reinforcements to clobber prices lower....To me, that would suggest that the market would take a look higher in search of an answer to the question: Are the bears strong handed or weak handed? Seems to me that probe into the singles from Monday (2115.75 - 2117.75) could answer that question.
There is plenty of price traffic before those singles from Monday...
yesterday's H =2112.00
Monday's POC 2112.25 and
Monday's VPOC 2113.00
and Monday's Close and VAH 2114.50 & 2114.75
So far (time now 7:48AM ET) in the overnight coming into today, the market has respected (respect is at the most 2 points, so if that changes in the mean time, this is baloney)
yesterday's
VAH at 2108.50,
afternoon Rally High at , 2109, important ref)
and the close (2108.00)
So, for yesterday, the overnight probed lower, but in the RTH, buyers prevented prices from even undercutting the ONL... Might want to probe Higher as the market searches for conviction (or just to screw the weak handed shorts) because in today's overnight, we have exceeded yesterday's high by more than a couple of ticks.but we are balancing ABOVE VA (not by much, but above it for right now).. .
NK, I read your post at the end of yesterday's forum about 2 consecutive poor Lows: I do not consider 2 TPOs to be an excess Low. 2 TPOs represents a poor low to me,even 3 TPOs is borderline for me... I like to see at least 4 TPOs and I salivate at 6 to 9 TPOs. BUT, If you get over 17 TPOs in a buying or selling tail, that tells me that there are too many on one side of the ball and that spike/buying or selling tail will probably get revisited either intraday (eliminating the truly OVERDONE buying or selling tail from the profile), or sometime over the next couple of days. These outsized singles can easily (and rapidly, like hitting a vacuum) get re-visited, as the markets recognize that it was too much, too fast (as is the case most of the time) so the markets need confidence builder by re-testing go see whether there is conviction at those spike levels.
Even a prolonged downtrend often gets a relief rally for a day after the first couple of tests down., maybe that is what can unfold today.
If I see RTH Open inside the VA, I would have to wait and see whether POC or VAL gets tested.
There are lots of balls to juggle today, I have only addressed a few of them and once we have RTH OPEN, where that open is and what price does immediately after the first 5 minute bar is probably going to be important to me... I think the day has big potential to swing up and down through the open several times and make only meager swings, but one thing I know about the markets is that you have to constantly assess the battlefield. What I think or what you think doesn't matter once the guns start firing.
Joe Ross is credited with saying "Trade what you see, not what you think." But that is very difficult to do because you can't define and recognize every single possibility, so you can't have a flow chart of profitable action for every single tick.
Good luck to all,
Thanks Paul. O/N action so far has been almost 100% long and has been in the upper half of YD's RTH range. The references listed by Paul are all important as well as the ones I listed. I will be focused on YD's RTH range and greenies for today
We are at the greenie from YD of 2107. Looks like we might open here. Is there likelyhood of a bounce from here? Since the O/N inventory was long for the most part of the O/N session, that would point to possible liquidation after the open which would be contradictory to a bounce from the greenie. Contradiction does not do me any good so I will side step this trade
The O/N greenie/VPOC is at 2110. So if we are to see any bounce over here, I would expect it to end/pause likely at that price
So that was a nice quick bounce from the 2107 greenie and we are almost at the 2110 I had mentioned earlier. I did not take the trade for the reasons mentioned earlier but this stuff works as we can see. It is really cool to see this in action in real time..
keep in mind, we still have not hit the 2107 greenie in RTH
Current low of the day is at YD's half-back (mid-pt). Weak buyers buying there
I do not see a whole lot of stopping points between here and 2089/90 except for the psychological point of 2100
pretty quiet out here.... feels very much like my office... all alone here
Emini Day Trading /
Daily Notes /
Forecast /
Economic Events /
Search /
Terms and Conditions /
Disclaimer /
Books /
Online Books /
Site Map /
Contact /
Privacy Policy /
Links /
About /
Day Trading Forum /
Investment Calculators /
Pivot Point Calculator /
Market Profile Generator /
Fibonacci Calculator /
Mailing List /
Advertise Here /
Articles /
Financial Terms /
Brokers /
Software /
Holidays /
Stock Split Calendar /
Mortgage Calculator /
Donate
Copyright © 2004-2023, MyPivots. All rights reserved.
Copyright © 2004-2023, MyPivots. All rights reserved.


