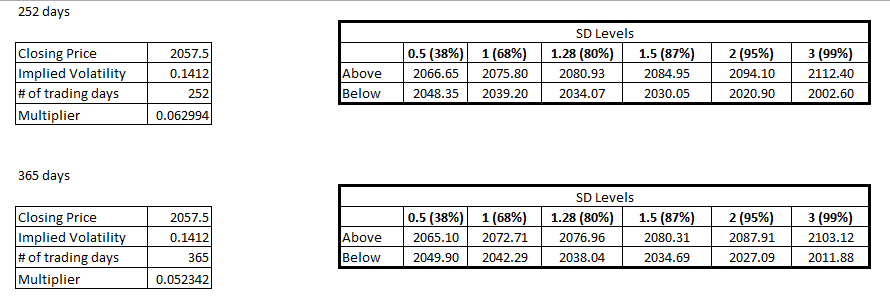
ES Friday 2-6-15
Sorry, I have a sick baby. I'll respond to you and Bruce as soon as I can
my gamble trade came off at 61.50.......holding one to see if I can get 54...LOL.....so now we see how often they like to test previous weeks highs and don't just blow through....this ok to do with runners or if u like gambling.....stop is at 63 currently and a long way to try and hold this ....
no apologies....hope your kid feels better....never a rush here at mypivots..."it's the easy laid back lifestyle"....sounds like a commercial.............
Originally posted by NewKid
Sorry, I have a sick baby. I'll respond to you and Bruce as soon as I can
tightening as we approach this 59.......gotta trail...don't want to give much back on one last measly contract....point is to have a good feel how often those weekly ranges get tested...." did I say 61 .25 enough today ?""""""" zoinks...no ego...just an fyi
that's it for me...the big score on last....hopefully most know why that was target,,,,see video or ask here.....this is center of yesterday and I have no clue from here...only thing I know is lately we have been having weakness of Fridays.....hope all have a great weekend...
Bruce, agree with you 100%. Dalton says this and I too believe in it. This is just 1 data point. Everything needs to be seen in context. Today for example, we had been one time framing higher on the daily bar and the value so far had been higher. That coupled with the fact we could not get into YD's range early this morning, left me bullish. Having said that, the market could not muster much above the O/N high and kept falling short. This would make me cautious for the trend to continue upwards. We tried once again to get into YD's range and failed and then when started to try again, that would tell me that there was a good chance of hitting YD's POC and maybe YD's VAL.
So yes, in isolation, this is a very dangerous thing to do but need confirming data points. Just like how we talk about confluence of numbers and zones, we also need confluence of data points to build a decent plan.
If we look back at 12/31, the day before on 12/30 we had gapped down and not closed the gap. So value was down coming into 12/31. Then as 12/31 RTH opened, we see that we could not break out of 12/30's VAH. So that tells us that the value is overlapping and possibly the trend would continue. And that is what happened after we coiled for ~3 hours. That trumped the POC.
Dalton keeps stressing that nothing is mechanical. Everything must be seen in context and the rules applied accordingly. I am starting to see and believe that.
Originally posted by BruceM
yes, that's good in theory but look at 12-31 for example...the poc was at 2077.25 and made in the first 3 hours...then we sold off the rest of the day without the POc migrating down...so be careful about all that stuff......I'm not saying u and dalton are wrong but it doesn't always work like that....many expect market to return to value and it doesn't....better odds of some kind of mean regression in the first 90 minutes then the rest of the day IMHO.......many on 12-31 would keep buying looking to return to the poc that didn't migrate.....u will see MANY days like that...and they would have lost big time..Originally posted by NewKid
basically you want the POC to stay down there and not migrate up. that would be a negative for the bears. this is something that Dalton stresses quite a bit on
Paul,
I am not 100% but I think that if we have back to back poor highs, then it increases the odds of them getting fixed. But Dalton says to not look at it blindly and look at other data to see if that is supported. The fact that we were having such a hard time staying above O/N high and the 61.25 level would have given him pause and I do not think he would have chased it.
I am not 100% but I think that if we have back to back poor highs, then it increases the odds of them getting fixed. But Dalton says to not look at it blindly and look at other data to see if that is supported. The fact that we were having such a hard time staying above O/N high and the 61.25 level would have given him pause and I do not think he would have chased it.
Originally posted by PAUL9
I am asking anyone out there...
What is the saying Dalton has about Back to Back poor Highs?...
Does he say that back to back poor highs increase the odds EXPONENTIALLY for what? to fix the poor highs or to signal that the short term market participants are TOO LONG and prices have to break lower before they can move higher?
I'm serious, I can't remember whether back to back poor highs create odds that they get revisited (and put in a proper selling tail) or that they can precede a break.
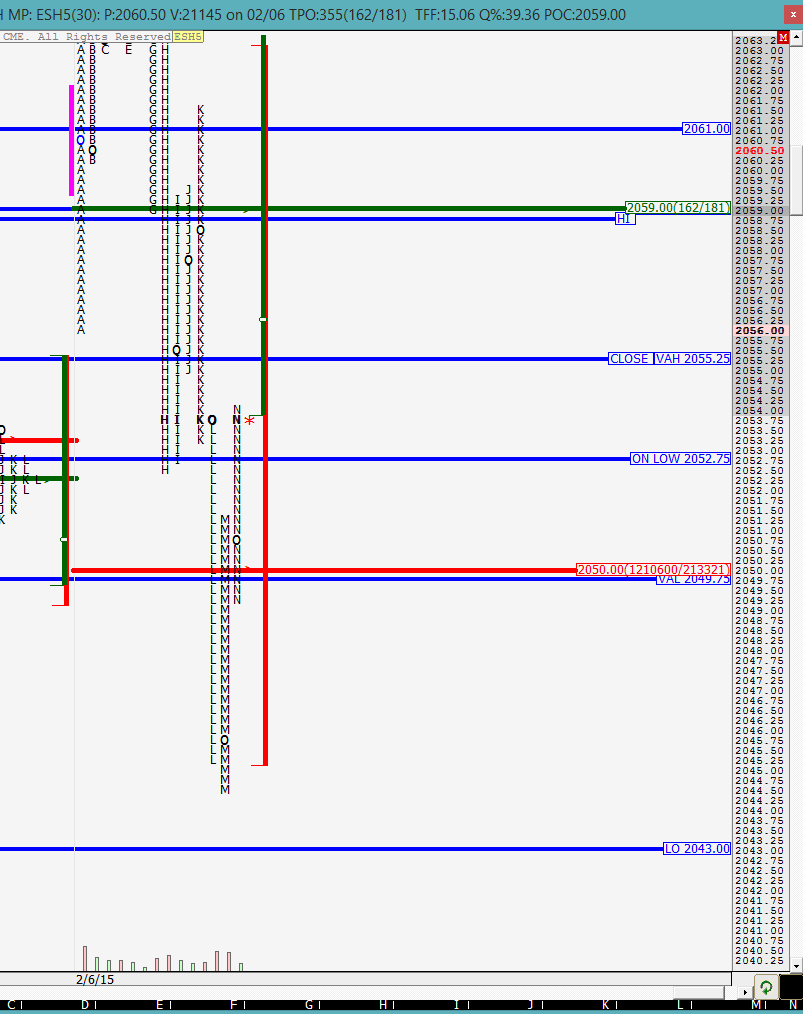
If you look at the G period low (the first drop), it came within 1 tick of YD's high. This is what Dalton classifies as a weak low because the buying came from a mechanical level and this points to weak day timeframe buyers buying. He expects these kinds of lows to be taken out if there are real sellers out there and not just liquidators. We see that in H period we went back to the POC, fell shy of the O/N high and came right back and took out YD's high very strongly.
just to be clear with everyone, i hate acting like a monday morning quarterback. the only reason i wrote the post-fact analysis was to answer Bruce and Paul's questions. I did not take any of these trades but just sharing my thoughts. Between Dalton's webinars (which started today at 6:15 am local time) and the sick baby, i am stretched and dont think is an optimal time to trade.
i am hopeful that in the near future i will be able to share my insights ahead of time.
i am hopeful that in the near future i will be able to share my insights ahead of time.
FWIW, there is a poor low in place right now with only 1 TPO of excess. With prices hovering around YD's high, if i were trading, i would have been tempted to attempt a short again over here with a fairly tight stop.
not trading, just trying to share some before the fact analysis.
not trading, just trying to share some before the fact analysis.
daddywolf, see the attached picture. i was referring to today's MP chart. Look at periods H and I. I came within 1 tick of H's low and rallied back to out of YD range. It tested the critical 61.25 level, made sure there was nothing there and came back to repair that poor low in the K period. We were in the J period when I wrote that post.
Emini Day Trading /
Daily Notes /
Forecast /
Economic Events /
Search /
Terms and Conditions /
Disclaimer /
Books /
Online Books /
Site Map /
Contact /
Privacy Policy /
Links /
About /
Day Trading Forum /
Investment Calculators /
Pivot Point Calculator /
Market Profile Generator /
Fibonacci Calculator /
Mailing List /
Advertise Here /
Articles /
Financial Terms /
Brokers /
Software /
Holidays /
Stock Split Calendar /
Mortgage Calculator /
Donate
Copyright © 2004-2023, MyPivots. All rights reserved.
Copyright © 2004-2023, MyPivots. All rights reserved.

