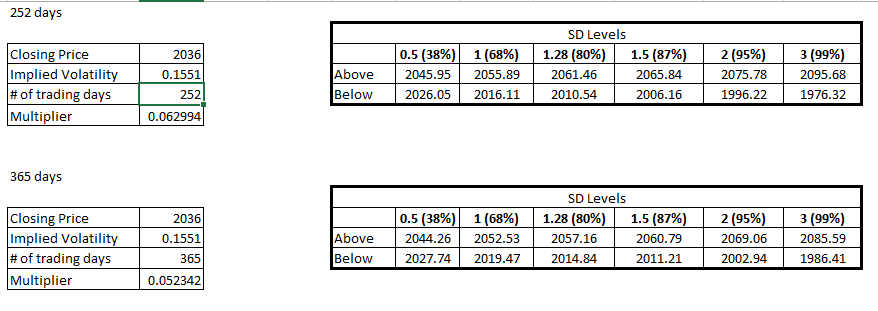
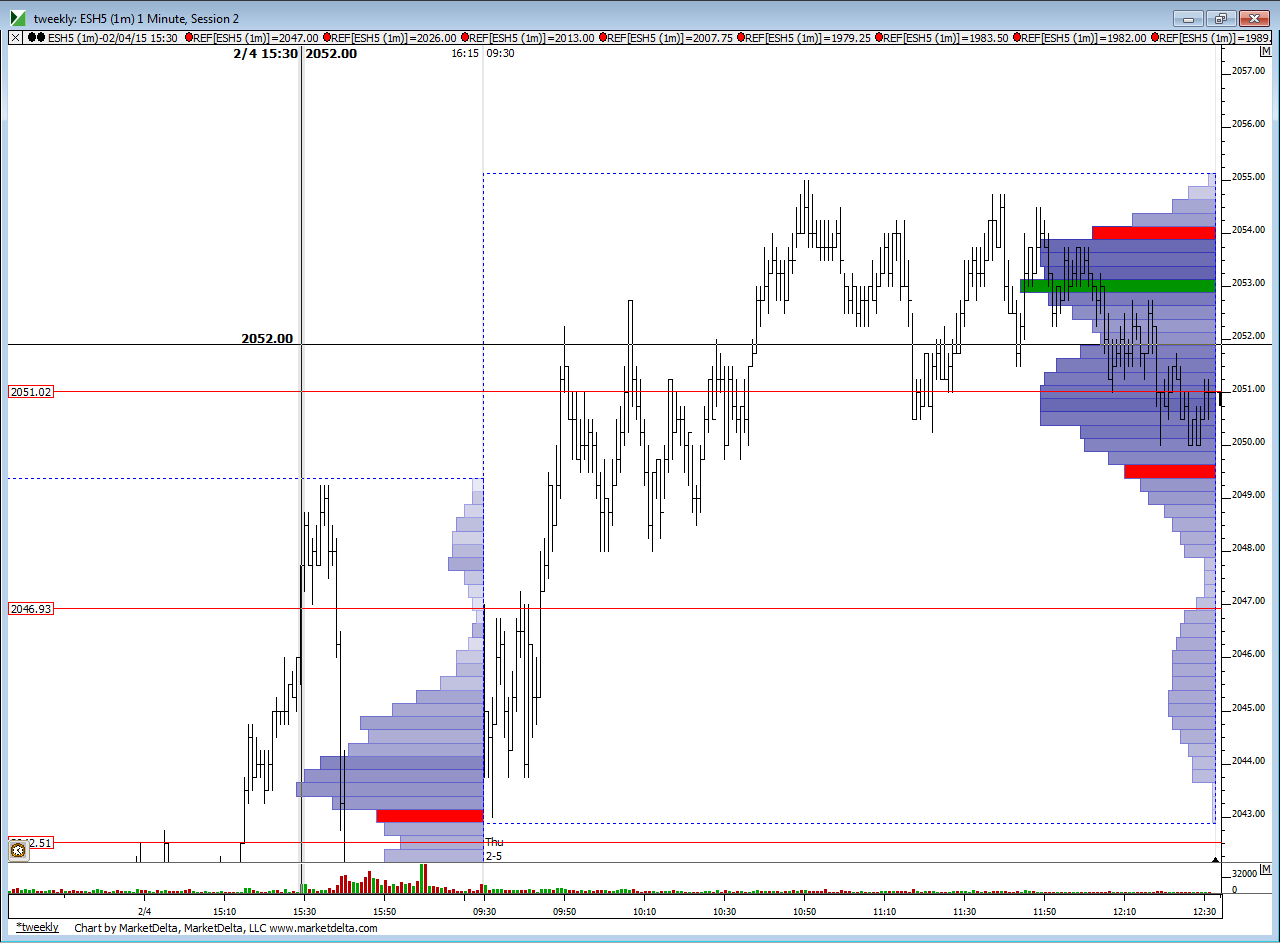
ES Thursday 2-5-15
i really should stop fighting the trend. value was higher today, they went back multiple times into YD's range and were rejected. In hindsight, one shot at getting back into YD's range was enough and then i should have changed my mind to going long. it is hard to switch your mind.
selling under 54 now.....
53.50 needs cleaning up...so may need to get aggressive at 55 print
...so I am treating the current high to 57.25 as a zone now.... they are trying to leave single prints at Ib breakout...so I still expect 53 to retest...just not sure from where...this is slow and painful to watch
coming out heavy at 52.75 print and hoping for more.......heck it's 11 a.m........just in time....a plus 8 - 10 zone too.....
still expecting that 47.75 to reprint before days end...just not sure how long I could stay in this dribble.....it's good that they are closing under IB high I think...most want want this too far beyond 53 on any retests up now...very lame volume today
working on the "P" pattern...will it be bullish or bearish...? see em both ways..
I know that a profile in the shape of a b is supposed to be longs liquidating... But does the close of the profile mean anything...
Here's what I'm talking about...
If there is a b shape to a profile...DO we suppose some more probes lower if the close for that 'b' profile is inside the wider part of the 'b'? (near the lows)
The reason I mention it is because if you look at the overnight coming into today, it has a 'b' shape (longs liquidating) BUT, the close for the overnight was way up there near the highs of the Overnight session, ===>>>Does that mean that the longs who wanted to liquidate are finished?
As I went back just a little in time, eyeballing rth only profiles... I see b profiles with closes in the bell and then it seems tendency for lower probe the next day.
as far as today goes, this is crucifixtion of the bears...
I just looked back to 1/9/15 RTH and there is a huge selling tail that (for 1/9) ran from 2052.50 up to 2061.
the first greenie overhead that I have is 2057 handle
I have no handle on what's going to happen.(that's a pun)
2057.50 is a greenie that coincides with the selling tail of 1/9 and I would like to see that print
you have to guess that at least today,
stops are loaded above the intraday High, and 2 points above that is a common push to trigger stops.
I have no positions at this time...
you have to guess that at least today,
stops are loaded above the intraday High, and 2 points above that is a common push to trigger stops.
I have no positions at this time...
Bruce,
In hindsight, my answer to your question should have been the following:
We have been 1 time framing higher for the past 2 days and we are bouncing off the low of an ~20 day trading range with the next target at 2061. With that information in mind and based on the O/N trading, I will continue to look at the market and see if value is higher today and if we continue 1 time framing higher. I need the market to tell me otherwise.
I know that this does nothing for you now since it is after the fact but for my selfish reason of learning, I needed to share that. :)
Originally posted by BruceM
you are very bullish newkid....why ?
Emini Day Trading /
Daily Notes /
Forecast /
Economic Events /
Search /
Terms and Conditions /
Disclaimer /
Books /
Online Books /
Site Map /
Contact /
Privacy Policy /
Links /
About /
Day Trading Forum /
Investment Calculators /
Pivot Point Calculator /
Market Profile Generator /
Fibonacci Calculator /
Mailing List /
Advertise Here /
Articles /
Financial Terms /
Brokers /
Software /
Holidays /
Stock Split Calendar /
Mortgage Calculator /
Donate
Copyright © 2004-2023, MyPivots. All rights reserved.
Copyright © 2004-2023, MyPivots. All rights reserved.

