ES Monday 1-26-15
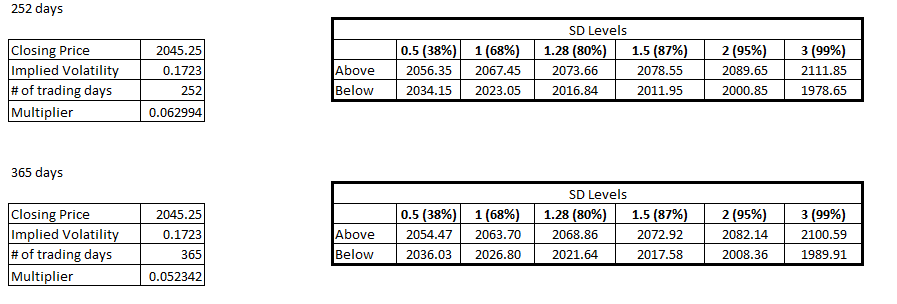
newkid...i think your volatility reading is off
Here's a short video that might be worth viewing... it actually might reinforce Bruce's maxim, trade early and say good bye.
the idea of trade early but not often...
http://emini-watch.com/overtrading-gambling/6358/?utm_source=feedburner&utm_medium=feed&utm_campaign=Feed%3A+Emini-Watch+%28Emini-Watch.com%29
He has a chart in the video showing the average 30 minute moves beyond either the high of the preceeding range or the low (in a down trend, the blue bars)
I guess the most important thing to grasp from this is that it is better (for capturing price movement) if you trade early, not often
His chart is a little flawed (IMHO) because he is only measuring the extensions BEYOND the range of the prior 30 minute bar, he is not showing the complete range of prices for each of the subsequent 30 minute bars, just the newer territory they hit on average (based on the last 3 years of the ES.
In other words, even though a 30 minute bracket might have only registered an additional 2 points when compared to the H of the prior bracket, that does not represent the swings in price that could have taken place inside the 30 minutes... price could have dipped 4 points and then moved up to exceed the prior bracket high by 2 points and it would have only registered as a 2 pt extension of the prior 30 minute range even though the pullback of 4 points was a buy worth 6 total points....boy, I hope I'm not confusing anyone..
It is interesting to note the larger range extensions (on average) apparent at the end of the trade day also (last 2 full 30 minute brackets)
Looking for a long @ 40 RTH
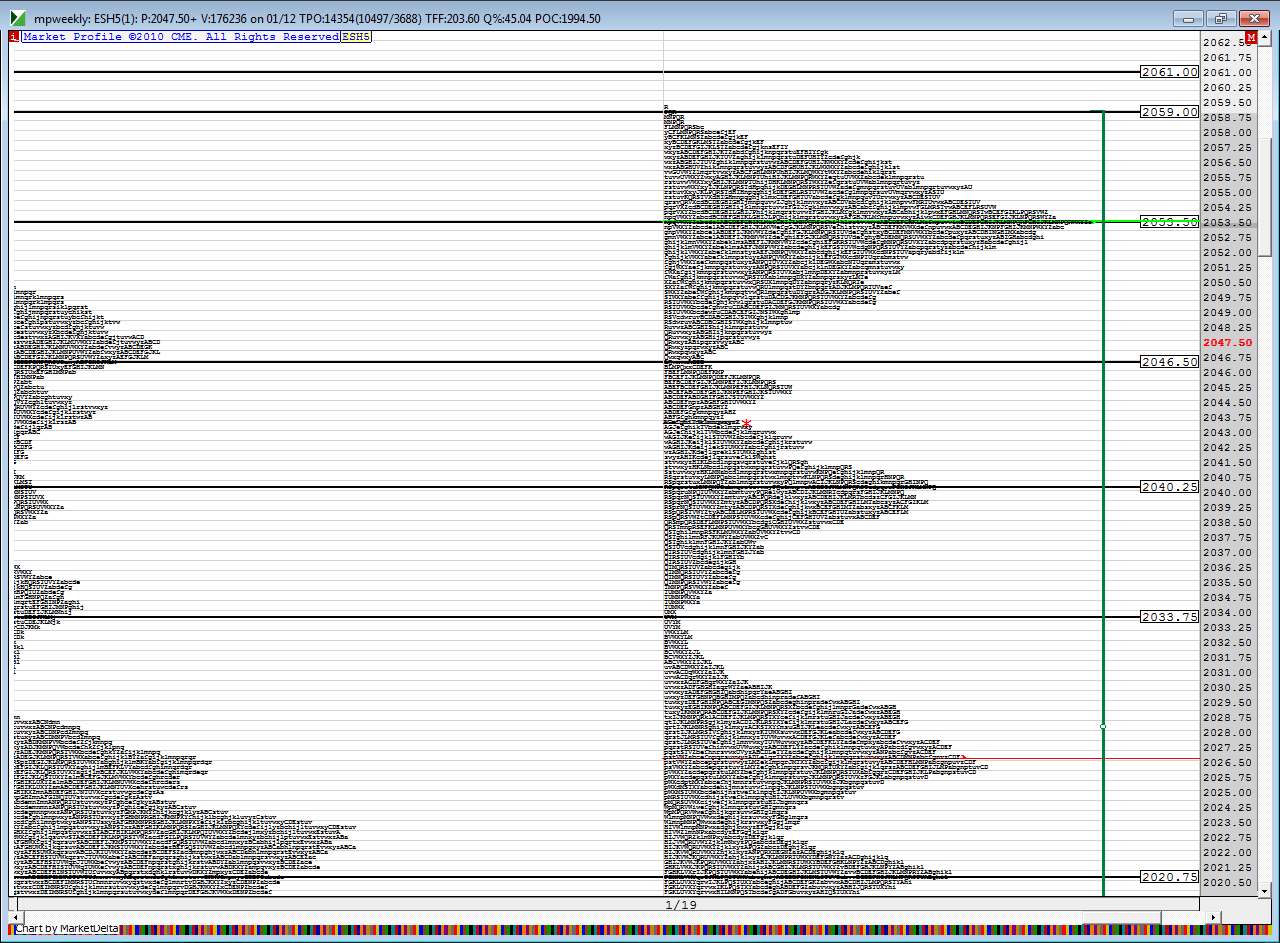
Pitbull number if we open around here, HVN and Euro IB high
Good luck to all!
Pitbull number if we open around here, HVN and Euro IB high
Good luck to all!
I'm hoping u get to buy my shorts big mike
39- 40 is now key if runners are to get that On midpoint......tuff call here
Originally posted by BruceM
39- 40 is now key if runners are to get that On midpoint......tuff call here
Got 'em Bruce! Was at least able to get them off quick for some green
30 min VPOC @ 38.75
I'd like to see 39-40 turn into support so we can go target 46 even...so will try to find very small longs on this test down now
thanks New kid...the astute trader will notice how they left singles behind on Ib breakout but then came back to fill them in....just an FYI...didn't take the short myself
Emini Day Trading /
Daily Notes /
Forecast /
Economic Events /
Search /
Terms and Conditions /
Disclaimer /
Books /
Online Books /
Site Map /
Contact /
Privacy Policy /
Links /
About /
Day Trading Forum /
Investment Calculators /
Pivot Point Calculator /
Market Profile Generator /
Fibonacci Calculator /
Mailing List /
Advertise Here /
Articles /
Financial Terms /
Brokers /
Software /
Holidays /
Stock Split Calendar /
Mortgage Calculator /
Donate
Copyright © 2004-2023, MyPivots. All rights reserved.
Copyright © 2004-2023, MyPivots. All rights reserved.


