ES Wednesday 1-7-15
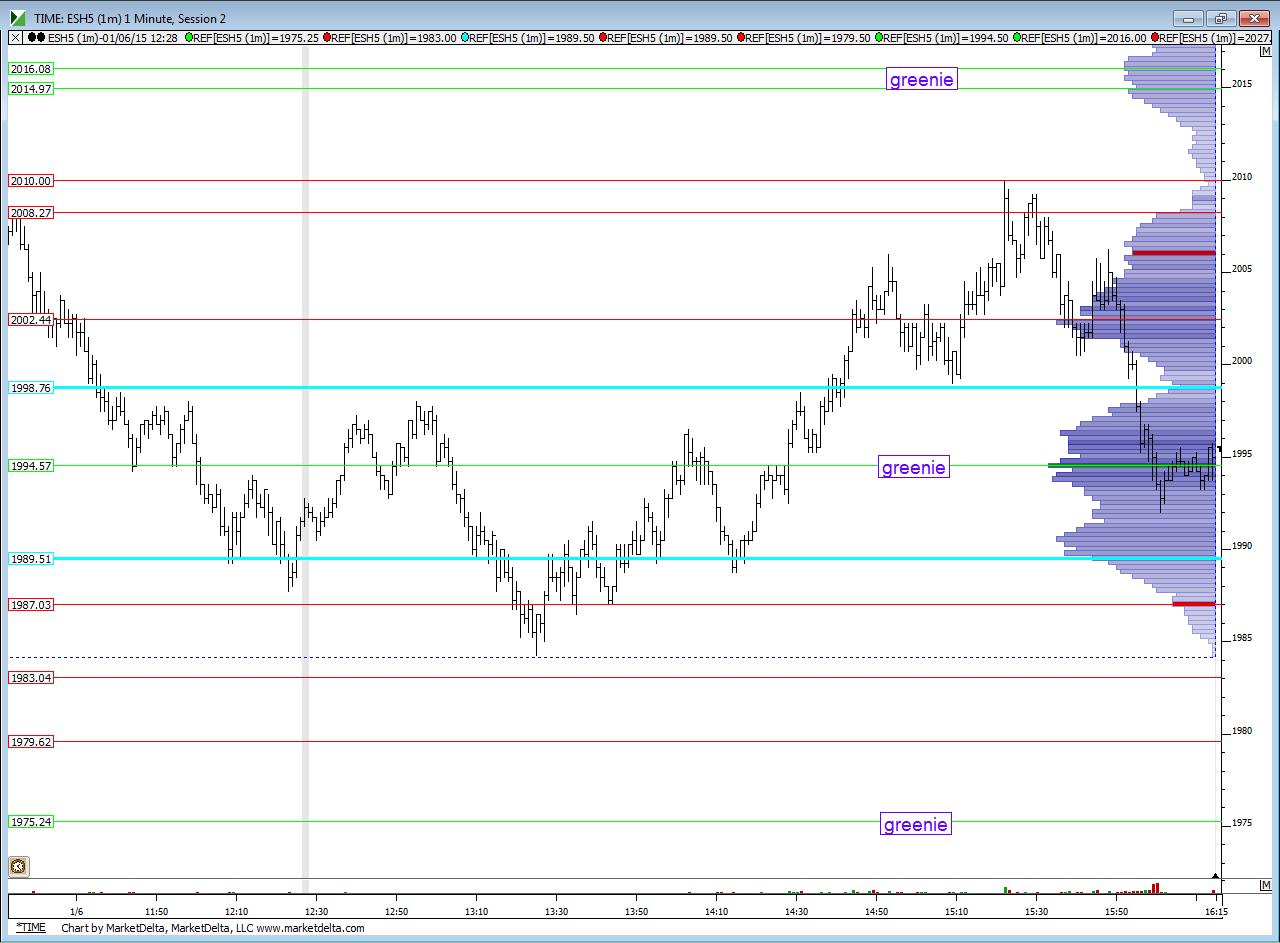
here's how I marked up my chart....Blue lines are Va Highs and lows....will confirm in the morning with Overnight action...FOMC today
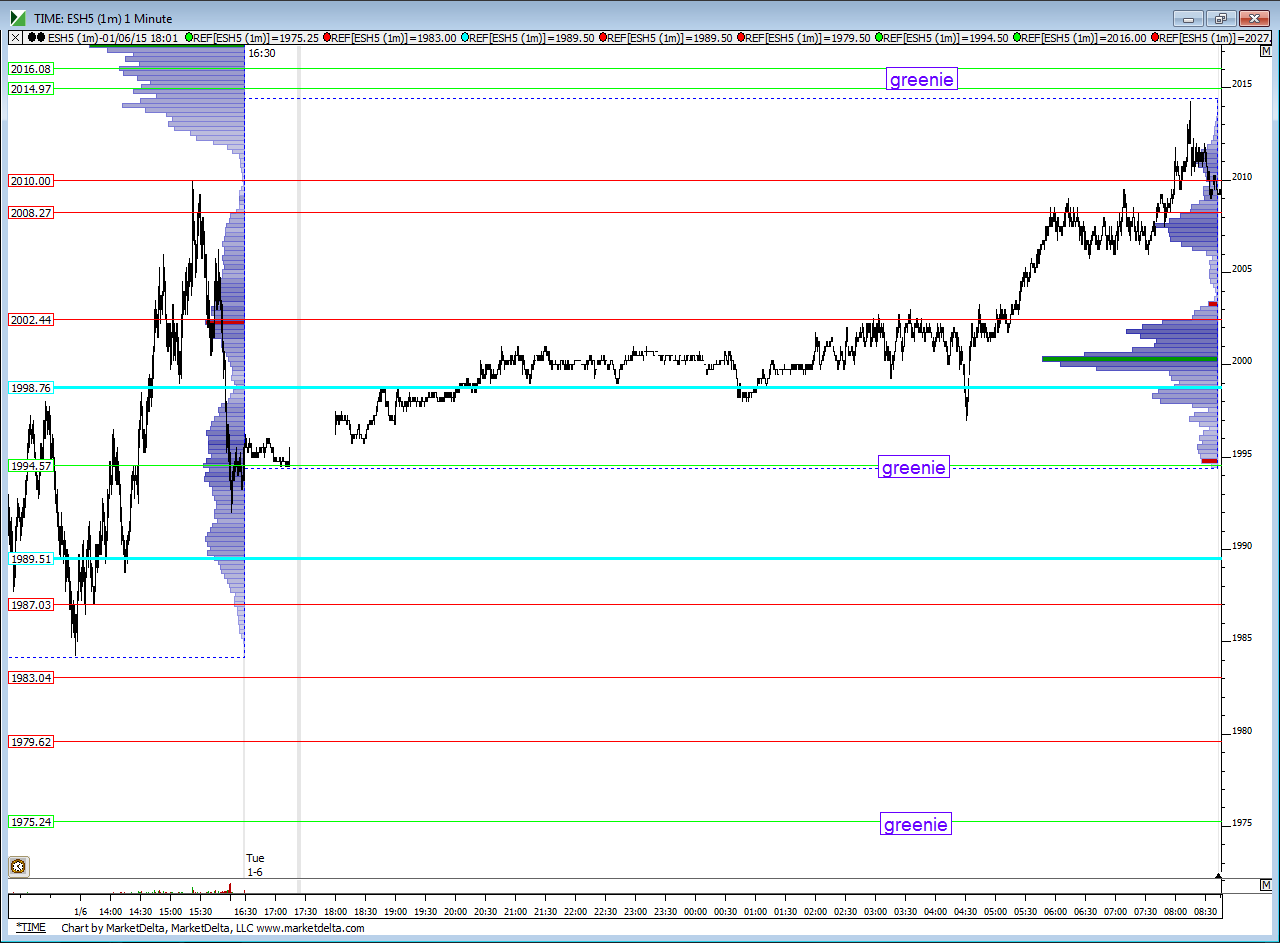
UPDATE :here is how the overnight has played out against our zones.....two greenies on the chart and they will print at least one today ...so Greenies/Volume at 1994.50- 96 and also at 2014- 2015....sure seems like the 2008.50 - 2010 will the deciding factor as to which one will print today....also watch that 2002.50- 2004 as that was a key line and On midpoint rests there as I type
UPDATE :here is how the overnight has played out against our zones.....two greenies on the chart and they will print at least one today ...so Greenies/Volume at 1994.50- 96 and also at 2014- 2015....sure seems like the 2008.50 - 2010 will the deciding factor as to which one will print today....also watch that 2002.50- 2004 as that was a key line and On midpoint rests there as I type
why so quiet? are people still reading the minutes? there usually is already a reaction, isint there?
yeah...that sure was muted...perhaps they are waiting to see how bonds go off !!
Bruce, i see people talk a lot about looking at the bonds, the yen, the dollar, oil, etc while trading the ES. I personally find it very overwhelming. Do you look at other factors?
the short answer is ...." NO "........but I guess for a longer term trader it might work.........the first 90 minutes there are so many internals that are distorted that it doesn't really pay to watch them IMHO...your mileage may vary !
Originally posted by NewKid
Bruce, i see people talk a lot about looking at the bonds, the yen, the dollar, oil, etc while trading the ES. I personally find it very overwhelming. Do you look at other factors?
wow...a pop up to 2035 as I type........just who are these people trading at this time ????? are they going for that 37 - 39 area without us day traders on board?
Yup, they sure got that area real fast. I guess that was all the pent up frustration from lack of action post fomc!
Emini Day Trading /
Daily Notes /
Forecast /
Economic Events /
Search /
Terms and Conditions /
Disclaimer /
Books /
Online Books /
Site Map /
Contact /
Privacy Policy /
Links /
About /
Day Trading Forum /
Investment Calculators /
Pivot Point Calculator /
Market Profile Generator /
Fibonacci Calculator /
Mailing List /
Advertise Here /
Articles /
Financial Terms /
Brokers /
Software /
Holidays /
Stock Split Calendar /
Mortgage Calculator /
Donate
Copyright © 2004-2023, MyPivots. All rights reserved.
Copyright © 2004-2023, MyPivots. All rights reserved.

