ES Thursday 12-4-14
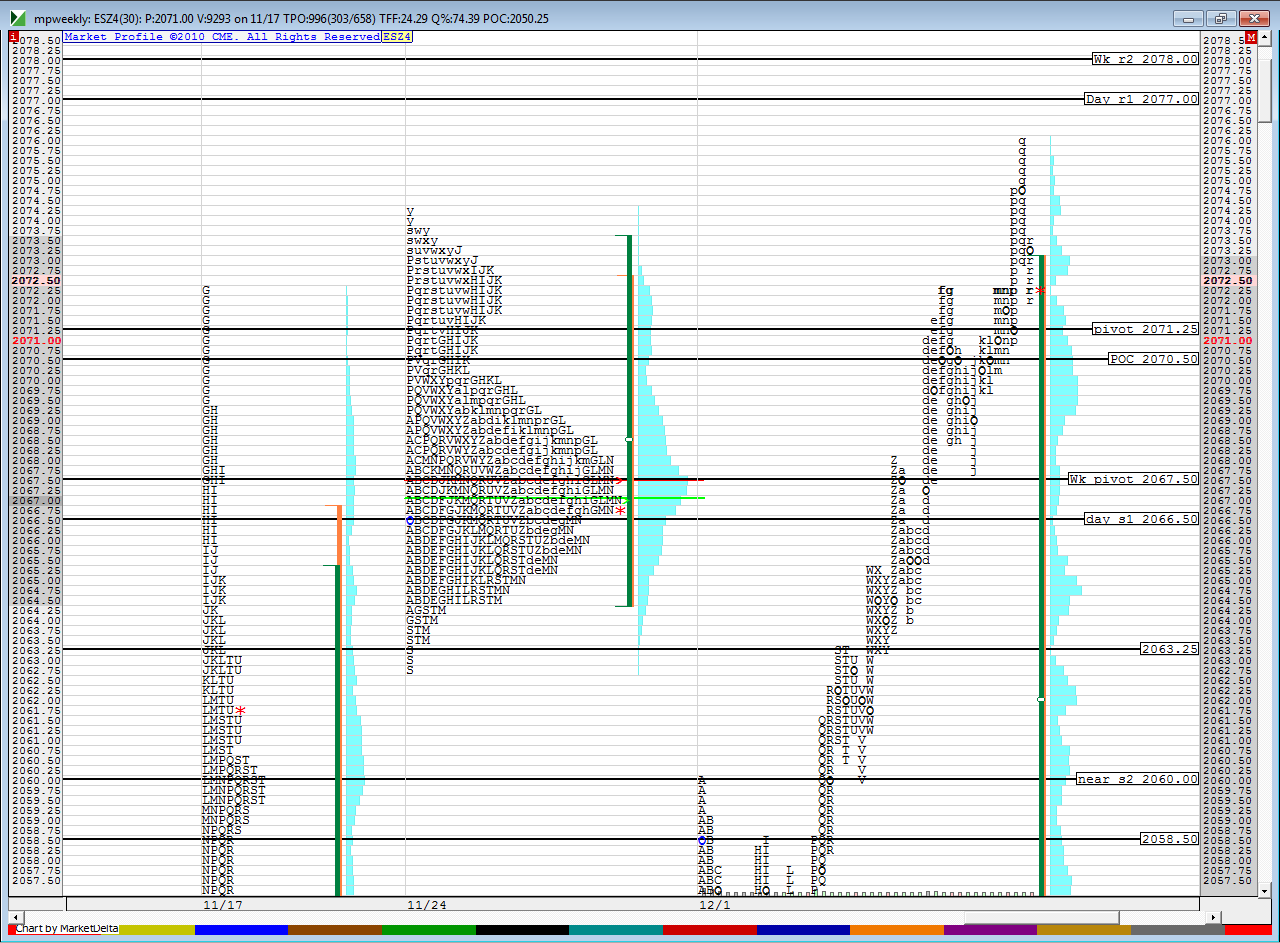
How my zones look for the overnight and Thursday trade...some nice confluence
SInce Bruce complained yesterday that he was commenting to himself, I thought I'd post
for anyone who looks at gaps...
Heads up for Thursday... Gap Guy says IF GAP UP, historically 8 in 10 odds for a profit if you fade the gap up open.
average gain for the winning trades is about 2pts 2 ticks (based on shorting the RTH OPEN if price gaps higher and holding til the end of the day or until the gap fills). which he doesn't recommend, but he only posts the performance of an intraday stop loss for subscribers
This was based on only 2 conditions: study filter was 2 days ago price closed at NOT a 200 day new High close... yesterday closed at a 200 day high close.
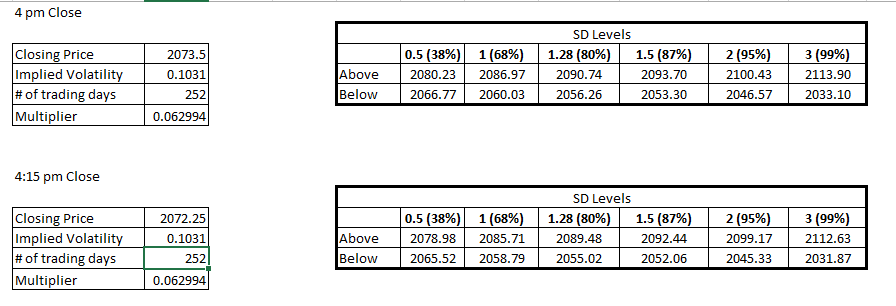
I believe he uses ES 4:15 last trade for his closes... yesterday that was 2072.25... so a gap up with an open at 2074.75 would be average
IF this thing gaps up and then just turns around and comes in to fill at 4:00 Close (2073.50) not worth much...
WARNING: if there is a gap up open and price just rockets higher... anyone blindly selling the gap up open might experience the gritting and gnashing of teeth when/if ALADDIN has to declare an open drive (up). YIKES
food for thought
In the immortal words of some commodity trading dude I used to know: "It's easy to trade, it's just hard to make money."
we now return you to your regularly scheduled comments
Bruce, my weekly pivots are slightly off from yours. I have the following data. Can you check to see if I have it correct and if not, which one is different? I suspect that you are using a different closing price? I have the last price from Friday.
Open 2066.75
High 2074.25
Low 2062.75
Close 2066.75
Open 2066.75
High 2074.25
Low 2062.75
Close 2066.75
newkid,
all the data I have for last week is the same as yours except for the High of the week you have...The Weekly High for the RTH last week was 73.25,
Here is the reason...
That High you have of 2074.25 occurred on a CASH INDEX Holiday,===>>> Thanksgiving Day.
On a standard weekly chart based on RTH trading ONLY WHEN THE DAY is A Regular cash trading day, 2074.25 would not be the High of the week (because it was not an RTH high on a day when there was regular cash index trading...
thanks Paul. That helps explain it. I knew I was missing something because of the holiday
Also weekly R1 is at 72.5 where we have seen a couple of bounces in O/N
you're welcome...
the bigger question is... does it really matter? I don't know.
There are times I can remember seeing price reverse exactly at pivot levels... BUT, I never expect exact to the tick for anything...
Even when price tests a previous day's High or Low (obviously not subject to calculations, they are what they are) it rarely does it exactly to the tick...
holy sh&$%##, guess market is not liking Draghi comments
that was one heckuva dip and back...
unfortunately i do not have data that goes back that much because i had not yet started collecting it.
i went through my set and it looks like i have only a month's worth. sorry
i went through my set and it looks like i have only a month's worth. sorry
Emini Day Trading /
Daily Notes /
Forecast /
Economic Events /
Search /
Terms and Conditions /
Disclaimer /
Books /
Online Books /
Site Map /
Contact /
Privacy Policy /
Links /
About /
Day Trading Forum /
Investment Calculators /
Pivot Point Calculator /
Market Profile Generator /
Fibonacci Calculator /
Mailing List /
Advertise Here /
Articles /
Financial Terms /
Brokers /
Software /
Holidays /
Stock Split Calendar /
Mortgage Calculator /
Donate
Copyright © 2004-2023, MyPivots. All rights reserved.
Copyright © 2004-2023, MyPivots. All rights reserved.


