ES Monday 10-27-14
anybody have weekly chart with volume on it? thanks in advance.. here are the numbers i got...1960-62..1956..1947..1943..1938..1930..1020-22..1906..1893..1882..1873-75..1860-62..
buying the 47.25 stop 3 point.. reason my 47and pitbull -4 and -5 number near by
1st target is 48.75
stop move to 46 cancel target
guess what lol out
this happens to me more than i care to say. dam wonder what would of happen it i keep the stop in the 1st spot..lol
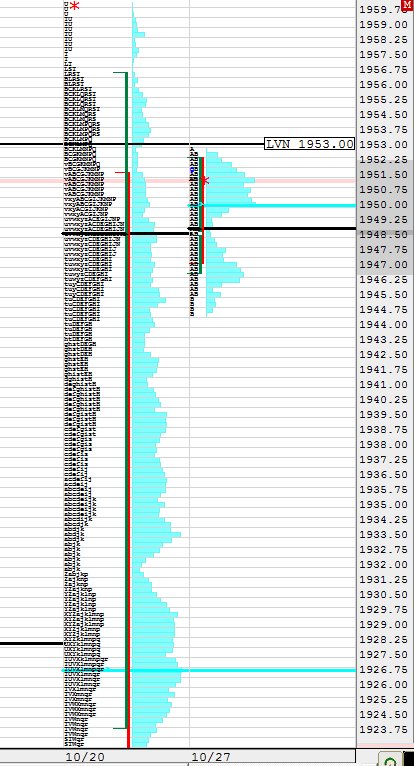
what were you looking for on the volume chart? daily RTH, Weekly,??
i was looking for weekly. dam thought i was alone..good to see you paul
I will try to get the chart into the forum.
I am trying to put the chart picture in here.
a couple of months ago, I have done this correctly (once) and I tried again after that and just got frustrated. I hope this works.
Hey, I think I got it... Remmber, last week HUGE range, just showing the top 75% of it
a couple of months ago, I have done this correctly (once) and I tried again after that and just got frustrated. I hope this works.
Hey, I think I got it... Remmber, last week HUGE range, just showing the top 75% of it
Overnight mid-point is 56.75...
Watching from the sidelines Duck, I do the same thing I micro manage my stops also, which usually gets me out to soon. FT71 says to try and manage your mistakes.. I believe we all have weaknesses in our trading and need to focus on them to get better.
Emini Day Trading /
Daily Notes /
Forecast /
Economic Events /
Search /
Terms and Conditions /
Disclaimer /
Books /
Online Books /
Site Map /
Contact /
Privacy Policy /
Links /
About /
Day Trading Forum /
Investment Calculators /
Pivot Point Calculator /
Market Profile Generator /
Fibonacci Calculator /
Mailing List /
Advertise Here /
Articles /
Financial Terms /
Brokers /
Software /
Holidays /
Stock Split Calendar /
Mortgage Calculator /
Donate
Copyright © 2004-2023, MyPivots. All rights reserved.
Copyright © 2004-2023, MyPivots. All rights reserved.
