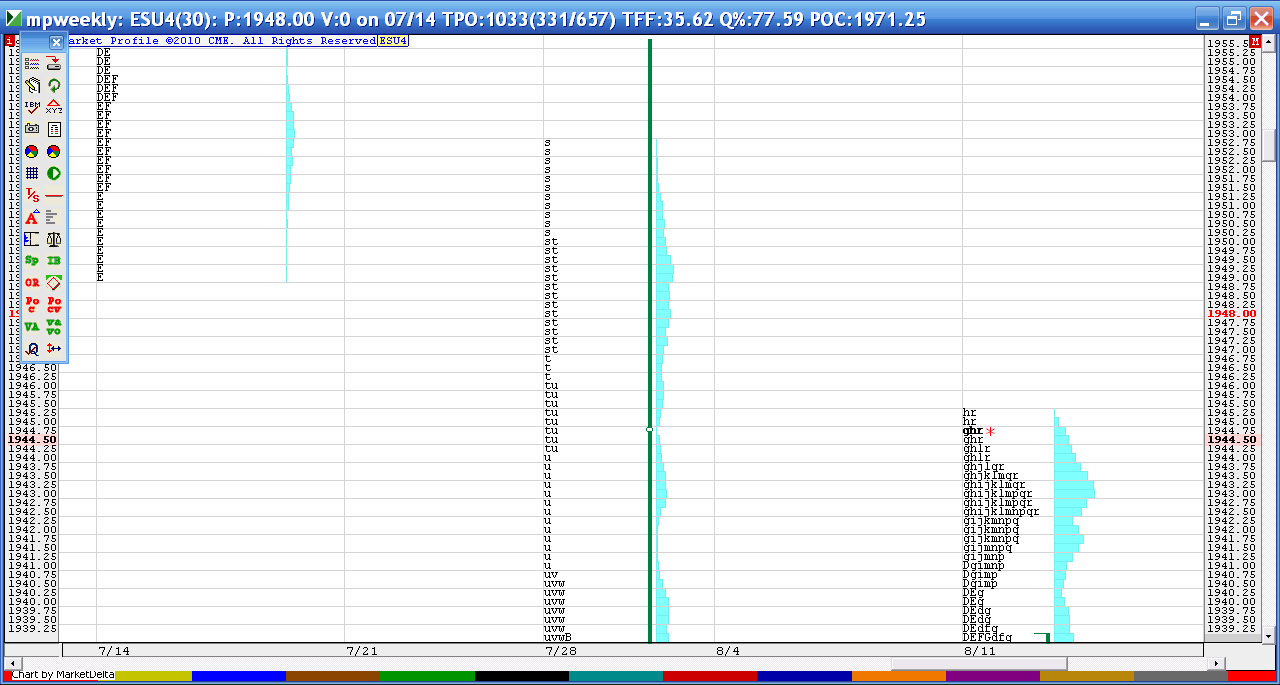
ES Thursday 8-14-14
how I see it and how the weekly charts are shaping up...note the low volume/time areas on part of weekly chart shown below...key areas today will be 46.25 and 49.25 on upside first....below is POC of yesterday and 38.50 - 40 as a zone
oh yeah...very nice work on Printers part...I'd like to see more of that stuff.....and sharks could u explain your footprint chart and how u interpret....even better would be a thread devoted to those kind after market close would be really cool too...anytime, anywhere...or in these threads.....
The market sure is taking its time with those 31/7 multi-distributions.
I'm beginning to wonder if they will trade that 1952.75 today or just leave that for tomorrow?
I'm beginning to wonder if they will trade that 1952.75 today or just leave that for tomorrow?
I realize that my chart isn't Markey Profile per say but more of buying and selling change as a measure of Delta. On the bottom is Volume imbalance as measured by upticks and downticks. At around 10:06 am I saw -3235 Delta to the downside or selling and at 10:13 am there was -3209. My take is that is excessive and we saw prices reverse around that time. Similar to footprint charts just different terminology. Hope that helps.
Sharks
Sharks
Emini Day Trading /
Daily Notes /
Forecast /
Economic Events /
Search /
Terms and Conditions /
Disclaimer /
Books /
Online Books /
Site Map /
Contact /
Privacy Policy /
Links /
About /
Day Trading Forum /
Investment Calculators /
Pivot Point Calculator /
Market Profile Generator /
Fibonacci Calculator /
Mailing List /
Advertise Here /
Articles /
Financial Terms /
Brokers /
Software /
Holidays /
Stock Split Calendar /
Mortgage Calculator /
Donate
Copyright © 2004-2023, MyPivots. All rights reserved.
Copyright © 2004-2023, MyPivots. All rights reserved.
