ES Tuesday 7-22-2014
The past 3 trading days could be some form of balance.
So I will consider the balance trading rules as per Dalton:
(1) Look above balance and fail; the opposite extreme of the balance would become the destination objective.
(2) Look above balance and accelerate leading to an upside breakout.
(3) Remain within balance and rotate back toward the lower end of balance
Yesterday was a 'double' inside day.
ES now opening outside previous day range near previous day highs and R2.
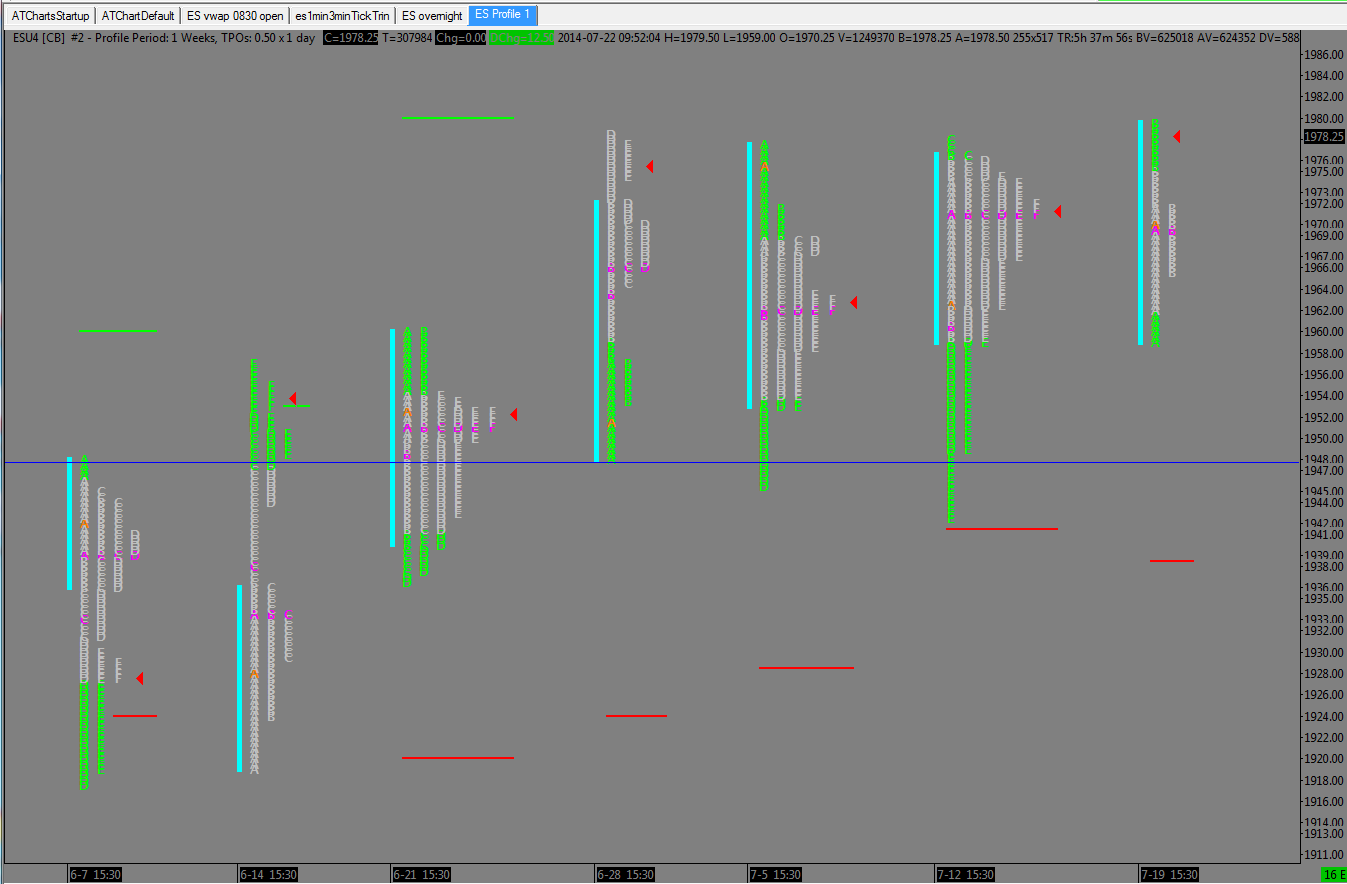
Hey Aladdin, Thanks for the posts the past couple of days. I appreciate the effort trying to keep posts going. I know when Bruce is away things get slow around here. Personally I haven't had the time to spend on these markets, hopefully that will change soon. I attached a weekly profile that lends some validity to your thought process. Now we just need to see which way she decides to go
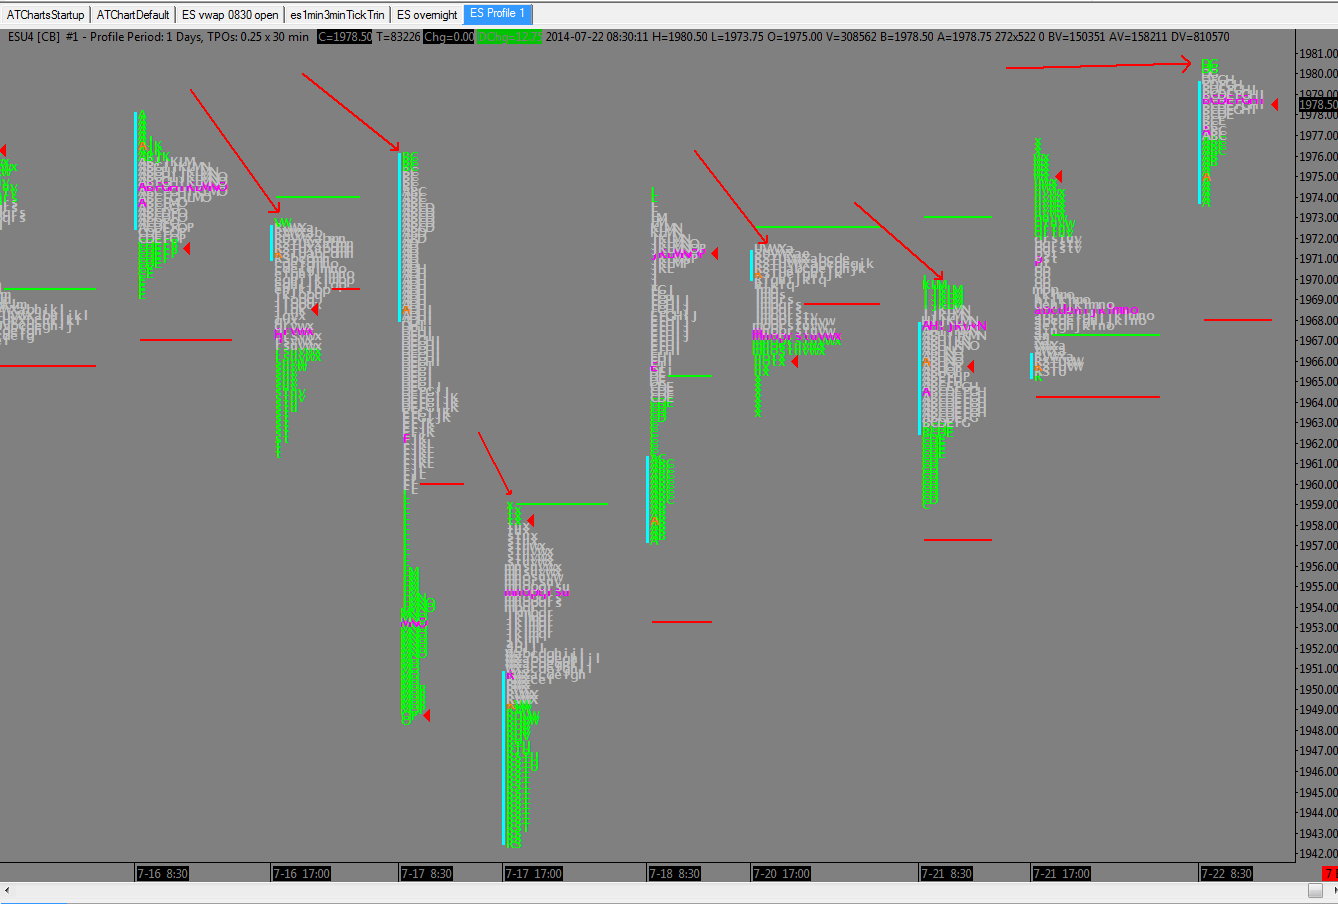
Look at the profile... before today, we had a poor High at 78.25, now we have a poor high at 79.50
when will it end? ES 2000?
this is brutally boring.... welcome to the summer...
no wonder Bruce took off for 3 weeks!
Paul excuse my ignorance --whats meant by a "poor high"
Brent.T
Brent.T
Originally posted by PAUL9
Look at the profile... before today, we had a poor High at 78.25, now we have a poor high at 79.50
when will it end? ES 2000?
this is brutally boring.... welcome to the summer...
no wonder Bruce took off for 3 weeks!
RE Poor High
Here's a great resource for market profile terms
I believe anyone can access this Jim Dalton Glossary
http://www.jdaltontrading.com/glossary/
I just checked the glossary, he has an entry for poor/unsecured Highs or Lows.
A poor high is not a strong High... meaning it was not an excess High.
When you have a high that has only 2 (or 3) TPO letters as singles in the tail, they often are corrected by getting revisited.
This is the opposite of an excess high... an excess high is a longer line of singles at the top of a profile. I like to see at least 4. Those singles (a selling tail) suggest that prices reached up to levels where a consensus was reached and the conviction of the sellers was so strong that price made a one way move (DOWN) plowing through any bids that were in the way and letting the market know that the bears have made a stand right there. . It's like the market reached a point where the sellers were emboldened and nothing could stop the drop.
A poor high is just the opposite... price reached up to a level and then just lolligagged around ... never able to generate one sided trade (selling)... so the tail at the high was maybe only 1 or 2 TPOs.
Many times poor highs can represent that the market is TOO long. everybody is a bull (very short-term) so there is no one left to buy and price can break lower to clear out the weak handed bulls and then start right back up.
A poor high can be corrected by a movement to the level of the poor high or higher that inspires traders to sell so deliberately that price can leave a longer trail of singles in the selling tail. (that would be a good high, also called an excess high because it created selling conviction, and probably has more than one intraday leg to it.
I hope that helps... save that link above, Dalton has a good glossary
also, in my original comment, when I said look at the profile, I was referring to daily profiles. Bkay59 and I must have both been writing at the same time because his chart of weeklies was not up when I started writing my original comment...
Other... we have just completed a bracket that explored above the IB H but then came back down into the IB for a close...is that something Bruce has mentioned before as a sign of potentially week demand?
Other... we have just completed a bracket that explored above the IB H but then came back down into the IB for a close...is that something Bruce has mentioned before as a sign of potentially week demand?
Thanks PAul very clear to me now......
Originally posted by brent.tToday we have a poor high (so far)
Paul excuse my ignorance --whats meant by a "poor high"
Brent.T
Originally posted by PAUL9
Look at the profile... before today, we had a poor High at 78.25, now we have a poor high at 79.50
when will it end? ES 2000?
this is brutally boring.... welcome to the summer...
no wonder Bruce took off for 3 weeks!
Here's a look at the dailies from the past few days, overnight sessions are included but the arrows indicate the many poor high's Paul referenced.
Emini Day Trading /
Daily Notes /
Forecast /
Economic Events /
Search /
Terms and Conditions /
Disclaimer /
Books /
Online Books /
Site Map /
Contact /
Privacy Policy /
Links /
About /
Day Trading Forum /
Investment Calculators /
Pivot Point Calculator /
Market Profile Generator /
Fibonacci Calculator /
Mailing List /
Advertise Here /
Articles /
Financial Terms /
Brokers /
Software /
Holidays /
Stock Split Calendar /
Mortgage Calculator /
Donate
Copyright © 2004-2023, MyPivots. All rights reserved.
Copyright © 2004-2023, MyPivots. All rights reserved.

