ES Wednesday 3-12-14
two possible support points I'm using this morning and those are 57.75 - 59.50 but more important will be 53.75 - 55.50...I think there are good odds that we revisit 64 - 65 and hopefully that won't happen before RTH opens...if on long fades from either lower zone use 62 as a first target just in case we get resistance at VPOC of 2-28...upper target if real lucky today will be 69.....if wrong on long idea then we may see 49 and lower today
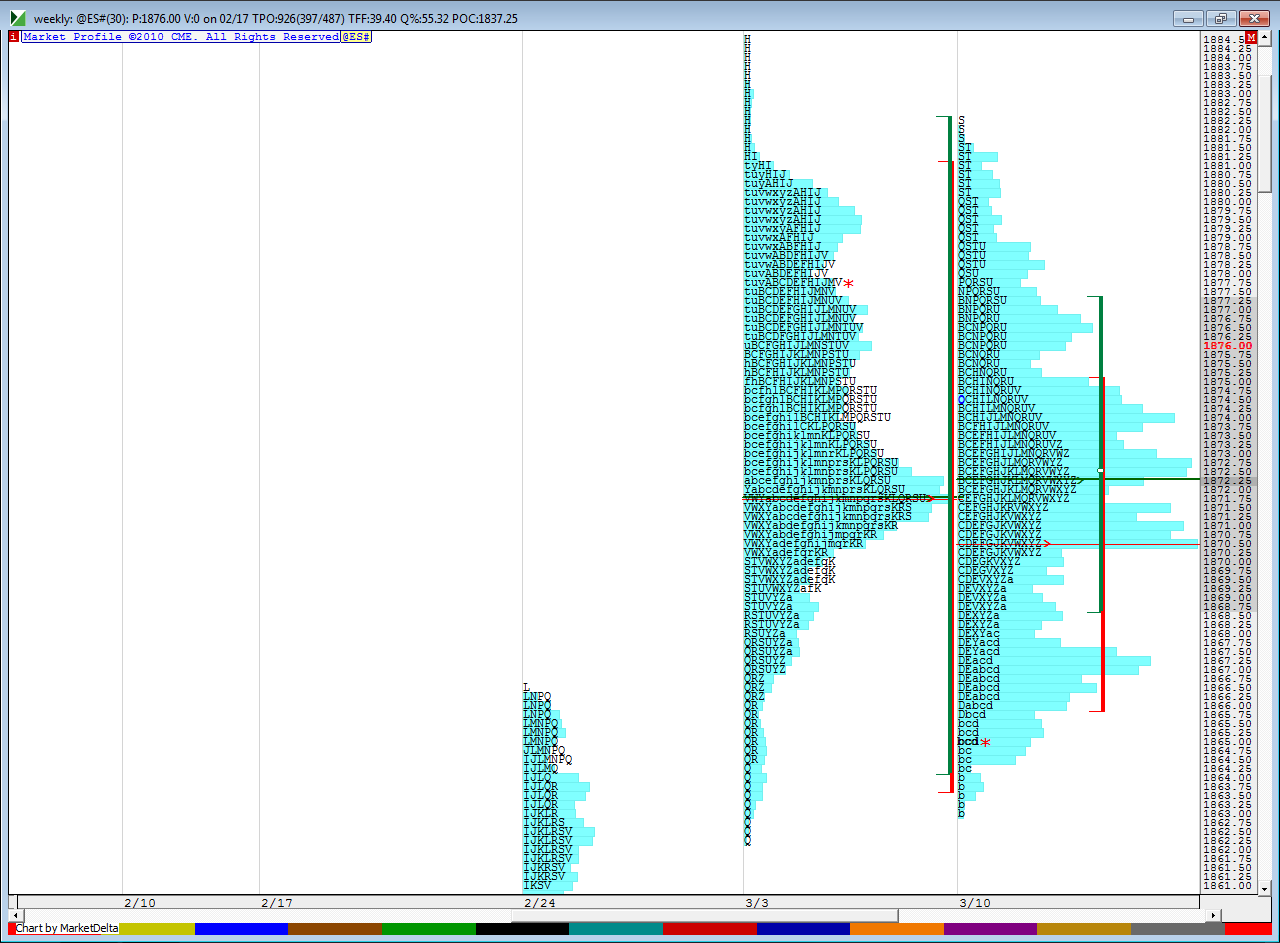
here is how the upper portion of last week looks against what is happening this week...concern on long fades will be that this is balance within balance so we know that can lead to trends
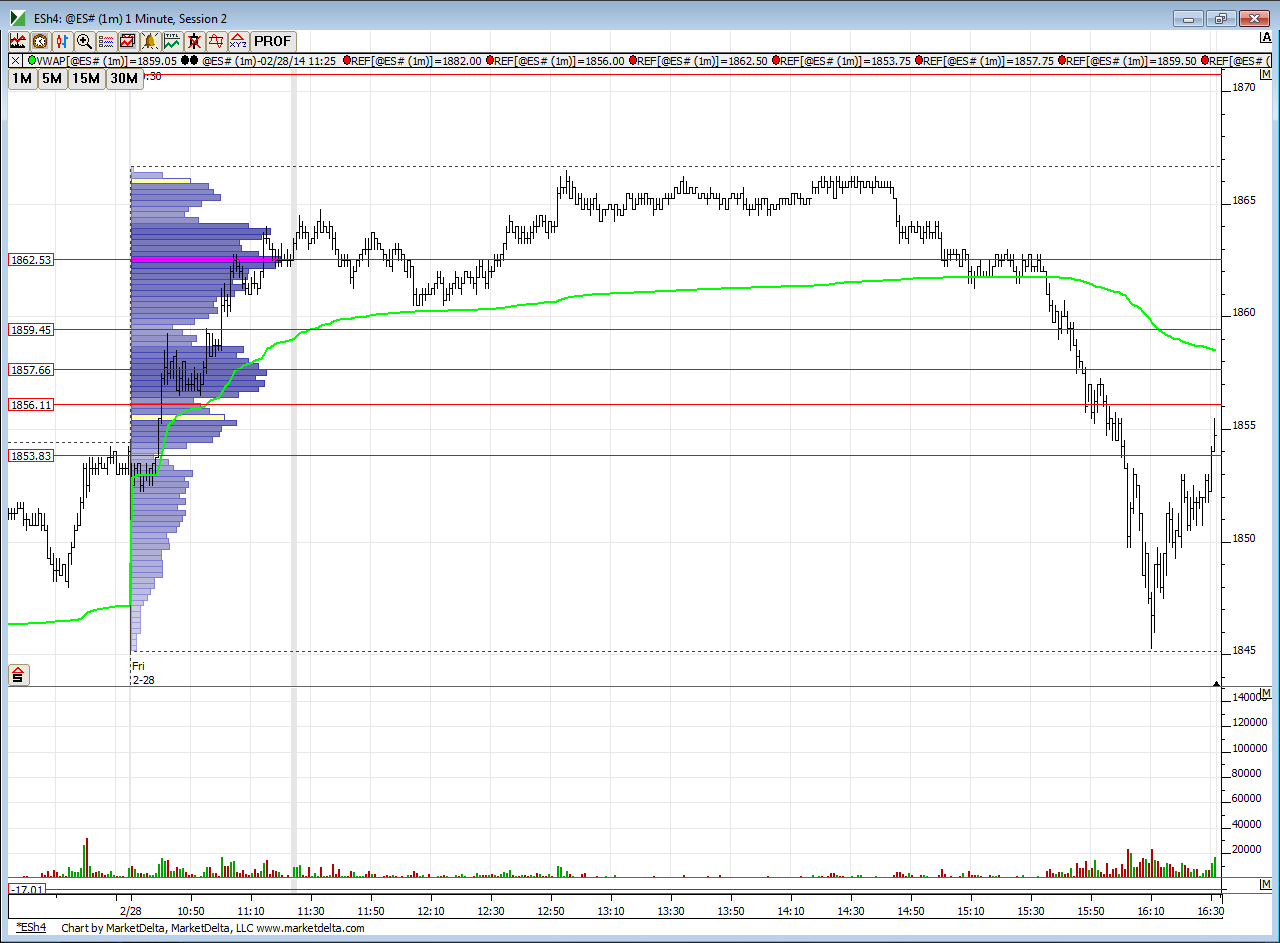
and here is the day we are opening up inside of 2-28-14
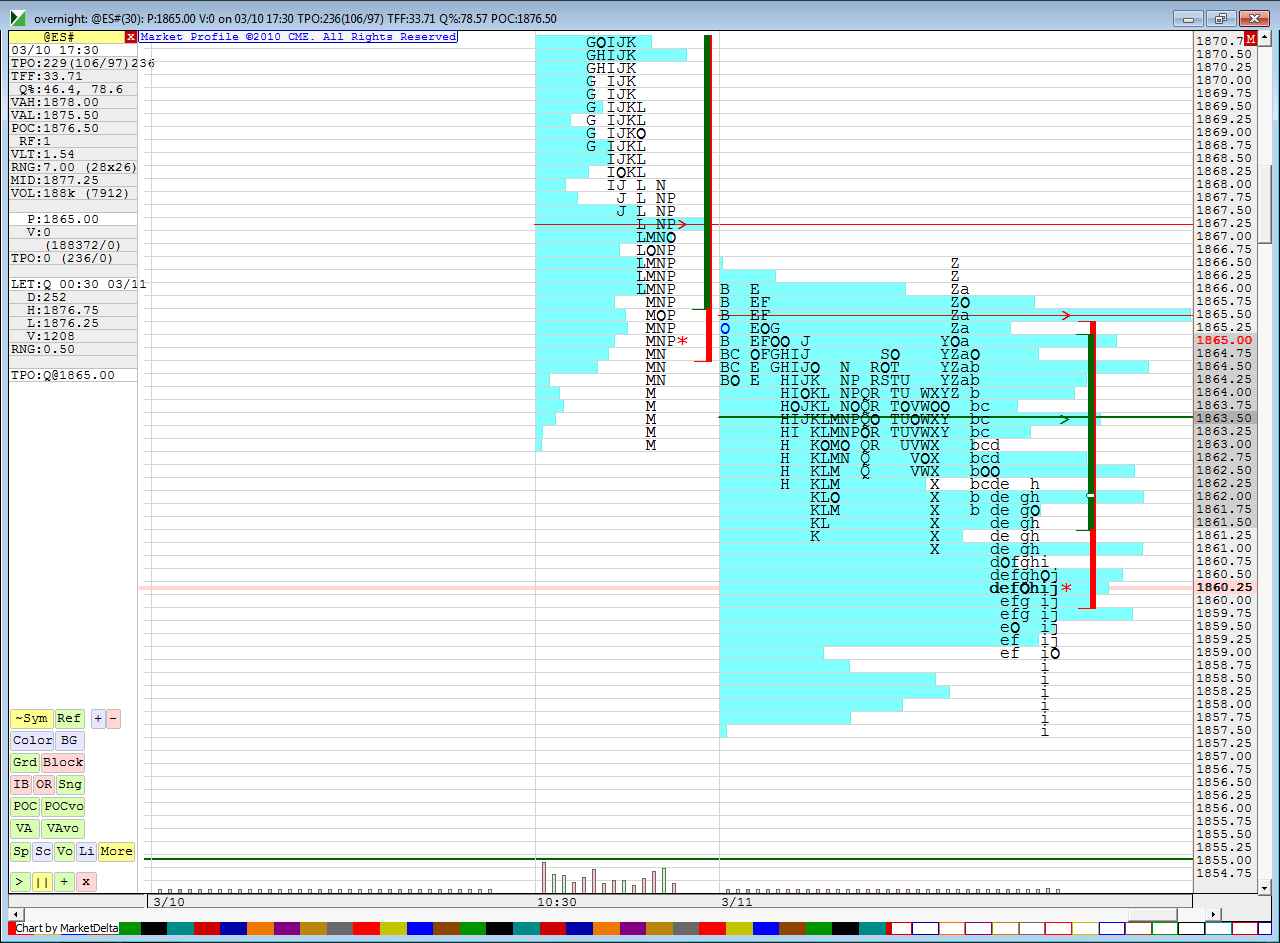
and finally what the On session is doing as I type
here is how the upper portion of last week looks against what is happening this week...concern on long fades will be that this is balance within balance so we know that can lead to trends
and here is the day we are opening up inside of 2-28-14
and finally what the On session is doing as I type
no signal off 66.area...using a range from 68.25 - 69.50 as next key sell zone
if short up here the risk point is to 70.75...we don't want to see it beyond that ..on first sell now at 67.50....will take 3 small tries up here...and use On high as first target
big volume coming at 68 but not convinced this is the high swing...I never am convinced of anything at this time of day
cool day if you look how often price has passed through key measure like the low of yesterday , the On high and the O/N low.....I usually expect to see at least two different TPO's ( 30 minute) pass through these when big traders don't seem to be around..
coming out on all but one at 65.50 after initial target was hit..single print fill is nearby and should fill in today
coming out on all but one at 65.50 after initial target was hit..single print fill is nearby and should fill in today
I see no reason not to have them test that 64.25 still even though single prints are here...painful volume now
flat at 65.50..not waiting and I think they will push above 66.50 again so why take the risk..so i don't know which one will print first..if 64.25 prints first then we could look for longs to go get 66.50...if 66.50 prints first then 64.25 is still a magnet
short 66 .25 after 66.50 printed...last trade of the day
all out at 64.25 print..very cool...and nice of them...gotta run..snow day for my kids and we are in Forum ghost town mode again...can't talk to self forever ...LOL!!
You have many listeners, me being one, that appreciate and learn from your dialogue. think of yourself as more a radio personality...
that's a good way to look at it tballenger....weekly Vpoc is now at 65 area...if this market gets a 30 minute close under the IB high I think we will see the 55.75 retest and lower today...( 1860 may get in the way possibly)....just watching for now in...... this 63 is THEE point to watch for clues...hoping something points the way in this chop...."P" profile so far seems to imply that buyers are struggling up here in upper third of todays range...
on the flip side if I am way off then we may still see that 69 and 71.50 today...only 8 minutes left inthis time period and so far it doesn't look like they are gonna get that close under the IB high...watching closely...best thing would be to see the close under and then look for a sell on a slight pop up off there near 64.75 expecting 66.25 to hold back any rally....ha..sounds good in theory
on the flip side if I am way off then we may still see that 69 and 71.50 today...only 8 minutes left inthis time period and so far it doesn't look like they are gonna get that close under the IB high...watching closely...best thing would be to see the close under and then look for a sell on a slight pop up off there near 64.75 expecting 66.25 to hold back any rally....ha..sounds good in theory
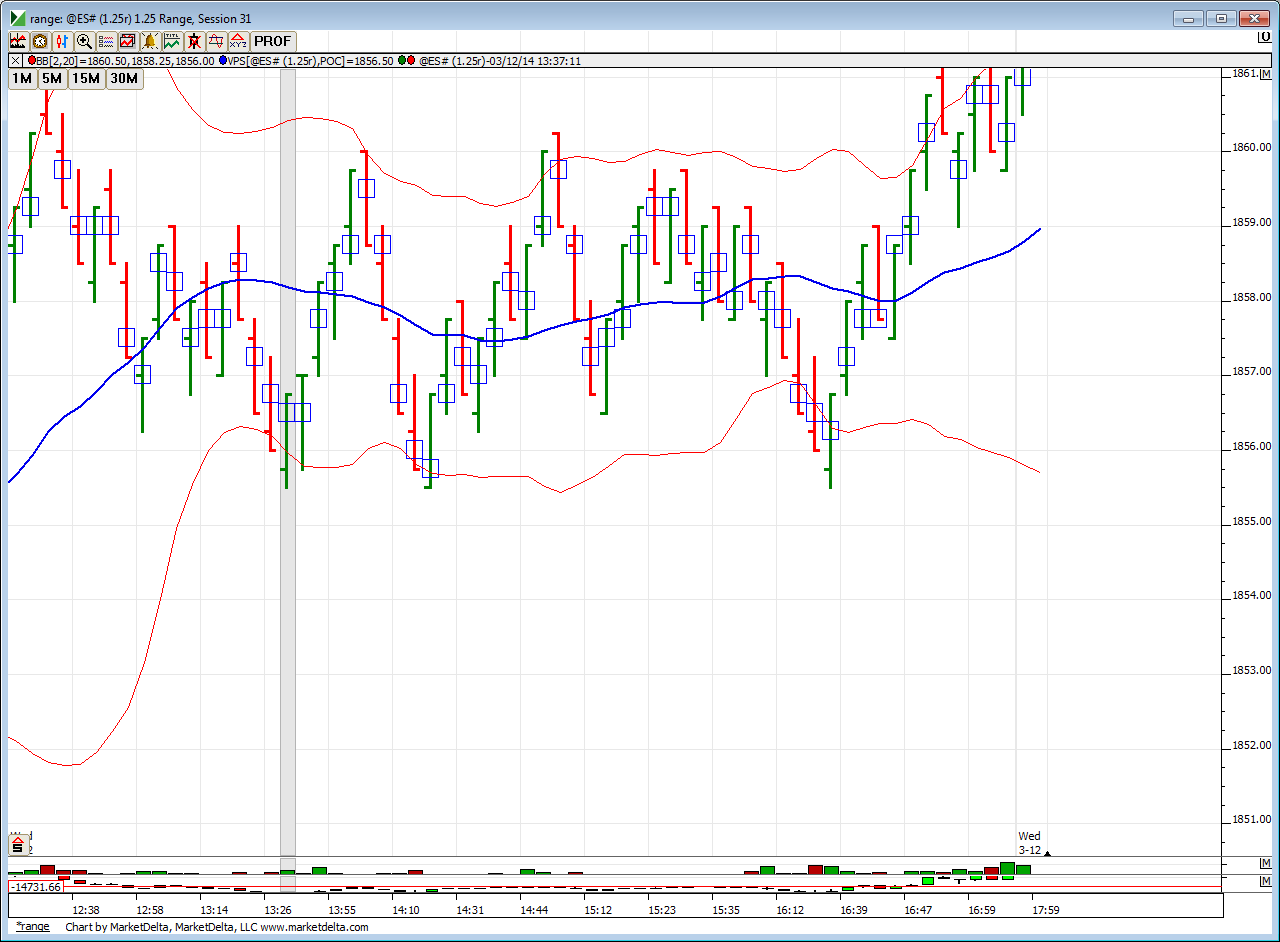
signals like these APK....this chart is 1 hour off....so eastern time is really one hour behind the posted times at the bottom.......and forget the bands for now.....this has also been rolled to June hence the difference in prices...you need to add 7 points approximately to these to coordinate the numbers I was talking about
Originally posted by apk781
Bruce, when you mention you did not get a signal, what type of signal are you looking at to execute ? Thanks, and great day today.
APK
Emini Day Trading /
Daily Notes /
Forecast /
Economic Events /
Search /
Terms and Conditions /
Disclaimer /
Books /
Online Books /
Site Map /
Contact /
Privacy Policy /
Links /
About /
Day Trading Forum /
Investment Calculators /
Pivot Point Calculator /
Market Profile Generator /
Fibonacci Calculator /
Mailing List /
Advertise Here /
Articles /
Financial Terms /
Brokers /
Software /
Holidays /
Stock Split Calendar /
Mortgage Calculator /
Donate
Copyright © 2004-2023, MyPivots. All rights reserved.
Copyright © 2004-2023, MyPivots. All rights reserved.


