ES UPDATE 2/22/14
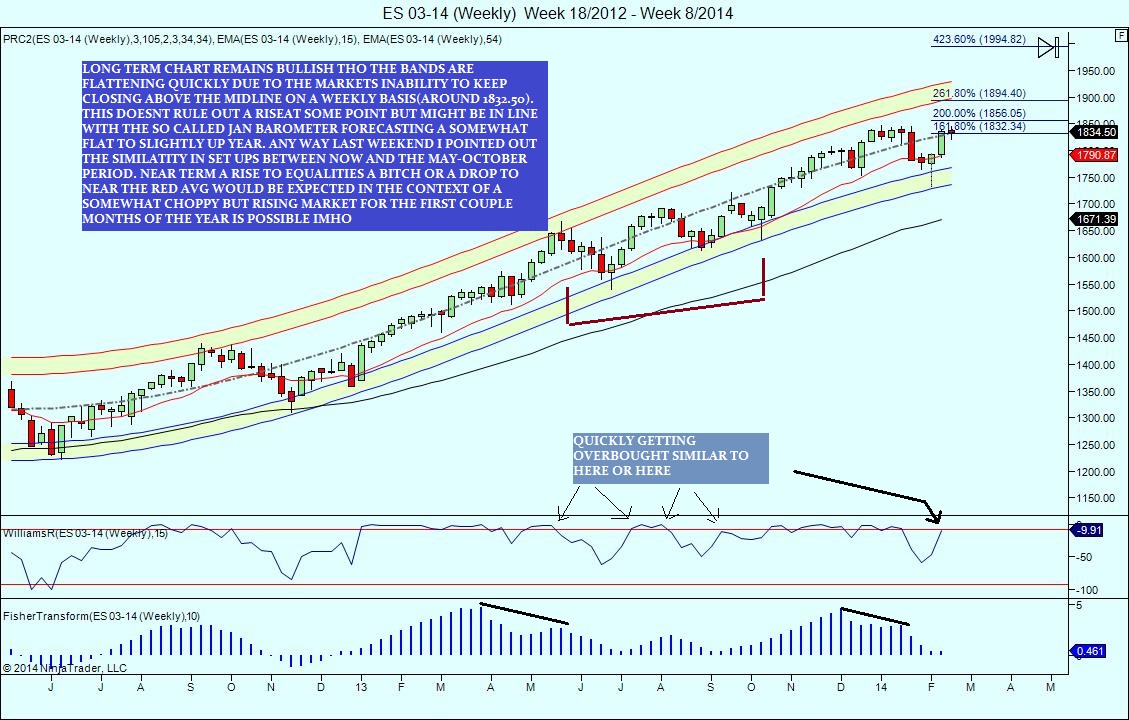
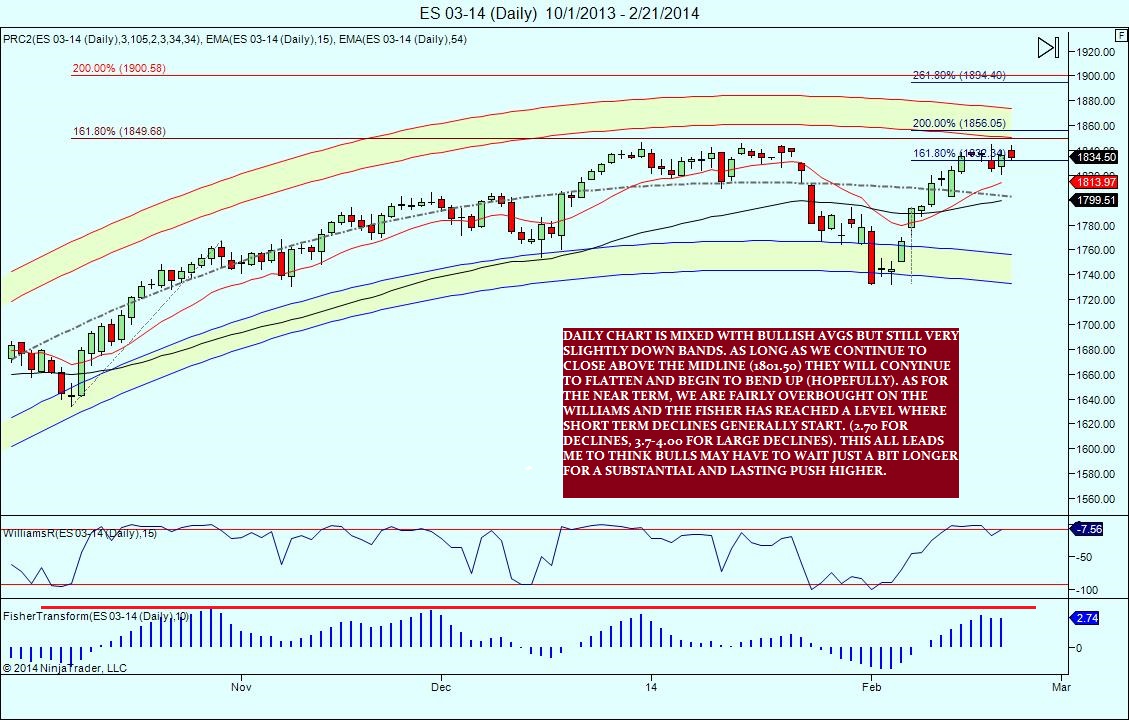
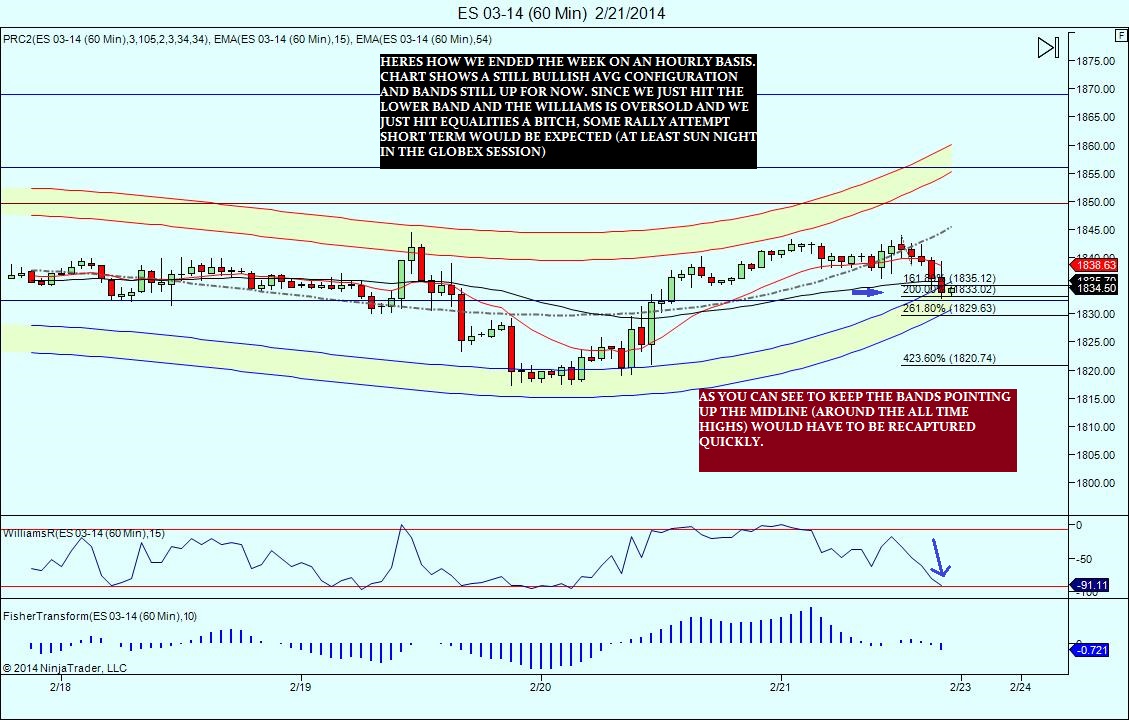
Early Dec i began to warn of an impending correction looming.. This probably seemed like heresy at the time as the unrelenting 2013 advance continued. I showed a monthly chart with cycles which identified jan as a prime candidate for a market top of some sort..Again in retrospect this was most likely dismissed as jan is almost always a strongly bullish month. Then the futures hit an all time high on Dec 31st and the cash hit its high in early Jan. I showed a pattern (as i love patterns! I'm a student of history when it comes to the market) called the old gap n crap which i showed to be due on Feb 3rd. I'm sure everyone was still in "2013" mode not suspecting what was coming. Throughout i remained overall bullish and tried to explain that sometimes markets correct in terms of time ,not just price.. so far this seems to be the case. Of course i'm, not batting 100% as i thought it likely we would pierce 1800 if only slightly. Anyway, the point here is that its not 2013 anymore.and we need a different mind set,objectively looking at our charts and expecting the unexpected!.. heres a long term look at the current state of affairs as i see it, and then some shorter term looks..Perhaps i will be proven completely wrong, but heres my best guesses! have a great week!
Thanks Kool
Koolblue, what do your bands represent? How are they calculated?
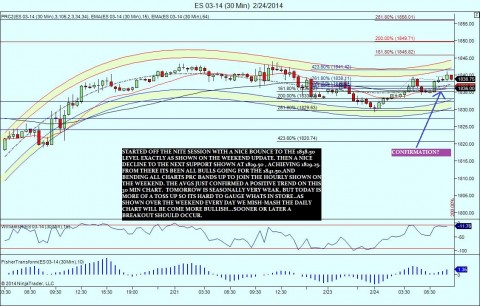
They are polynomial regression channels, which are basically 2 and 3 std deviations from a dynamically changing regression line. Idont know the calculation or formula.(its over my head!) They are similar to , but imho superior to something called "center of gravity bands...cog.. heres the current state of affairs...
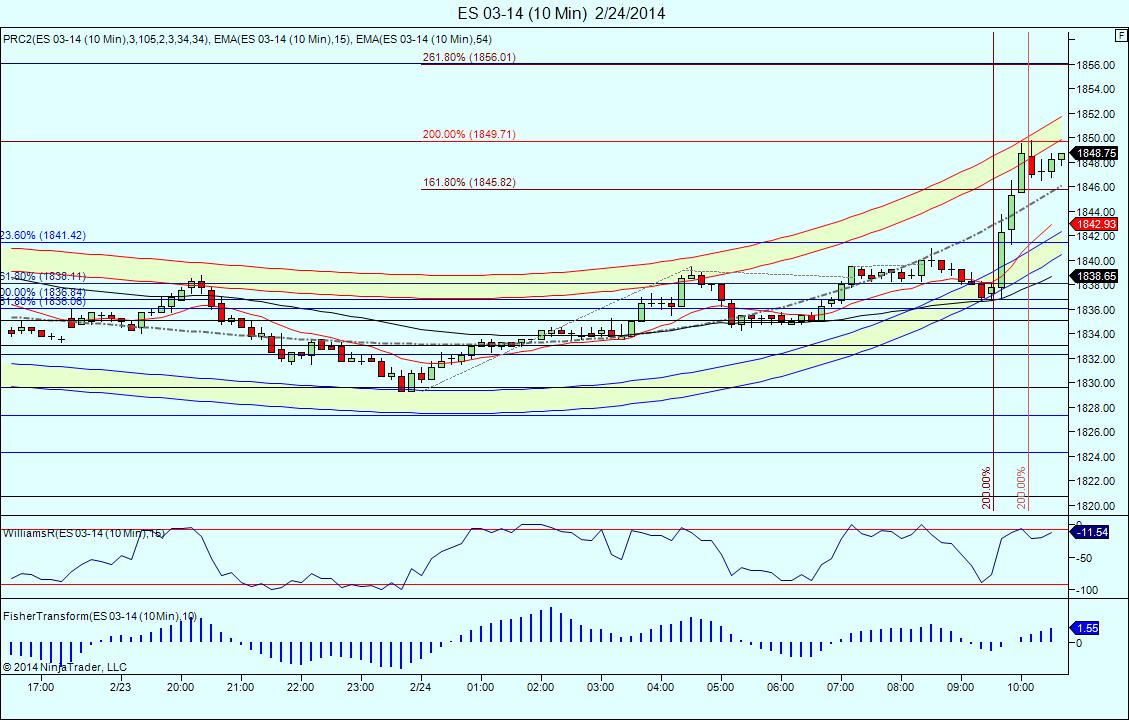
heres my posts from this morning on another website,to show how they factor into my analysis.. needless to say i was long the open this morning and my day is made...
Re: 02/24/2014 Live Update
Postby koolblue » Mon Feb 24, 2014 9:34 am
This could be the first little cycle bounce.. a while ago i showed how historically, the decline from all time highs would last either 6 or 9 weeks .. We then declined 6 weeks to the 1732.00 low. I dont know if it means anything ,but this is week 9! So if they want to bust out ,this would be a good week to begin,imho. But just a guess , due to seasonals i suspect it might be later in the week,if it happens at all..if it doesnt occur this week, that might be telling us something!...lol 8-)
koolblue, where are you posting these days?
Emini Day Trading /
Daily Notes /
Forecast /
Economic Events /
Search /
Terms and Conditions /
Disclaimer /
Books /
Online Books /
Site Map /
Contact /
Privacy Policy /
Links /
About /
Day Trading Forum /
Investment Calculators /
Pivot Point Calculator /
Market Profile Generator /
Fibonacci Calculator /
Mailing List /
Advertise Here /
Articles /
Financial Terms /
Brokers /
Software /
Holidays /
Stock Split Calendar /
Mortgage Calculator /
Donate
Copyright © 2004-2023, MyPivots. All rights reserved.
Copyright © 2004-2023, MyPivots. All rights reserved.
