ES Thursday 1-9-14
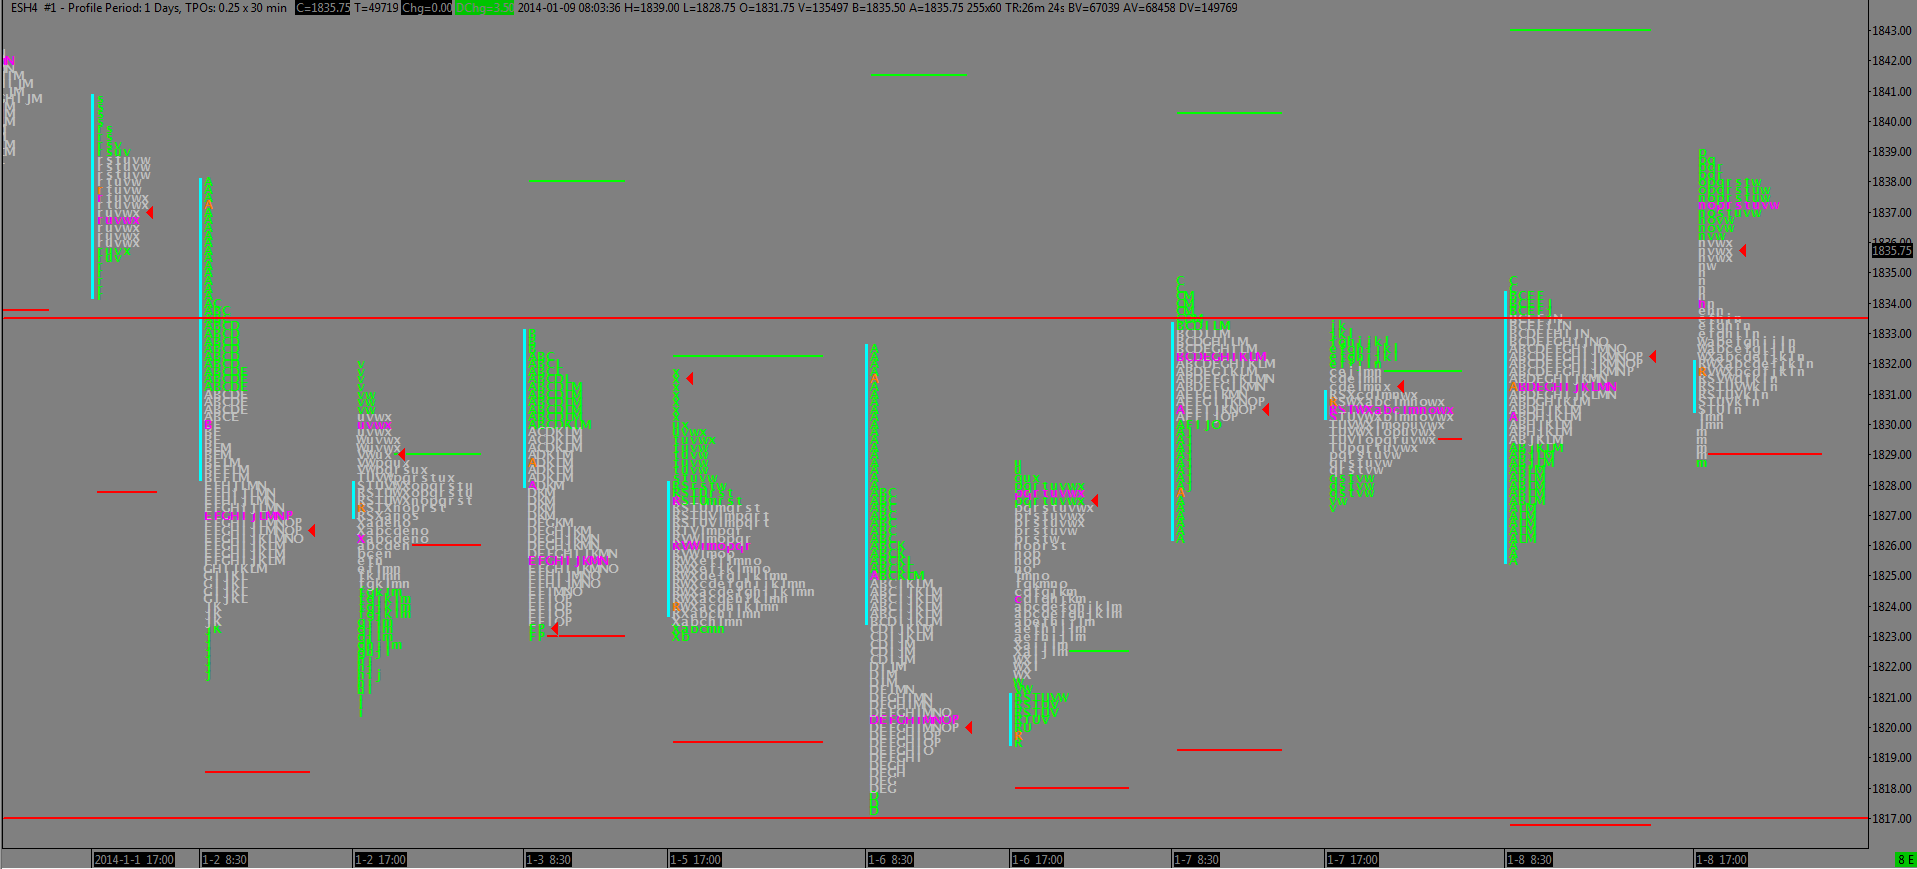
Here's an updated daily profile chart. the top red line at about 3350 is the area I identified as the top of the balance as of yesterday morning. As you can see we tested the top of that level several times, topping out at 3475, also Tuesday's high. Then in the overnight we have a clear DD with the valley right at that 34-35 level. I believe we moved up on Euro comments from Draghi. So the question, in my mind, becomes do the bulls protest that level and move up, or do we drop back into the previous BA?
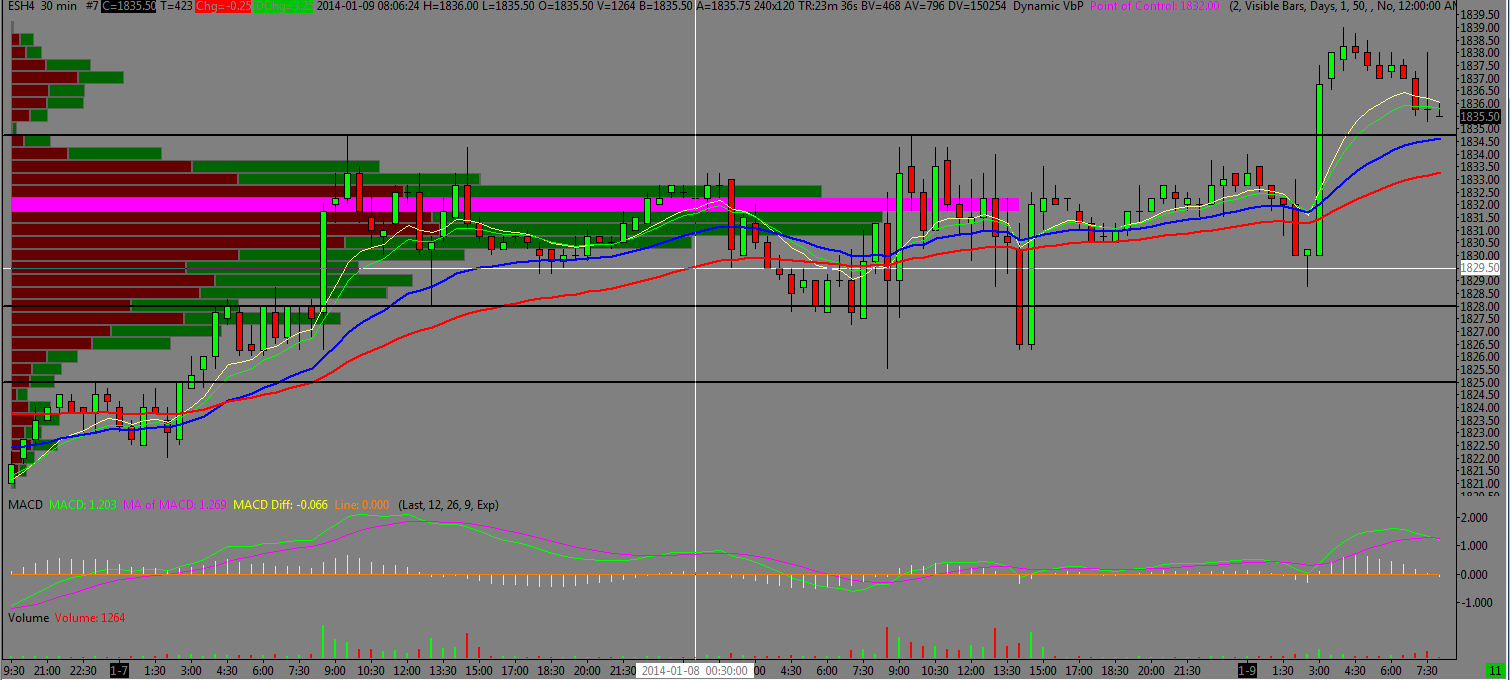
The second chart shows a relatively current 30 minute. The top line I have snapped I moved up from 3350 to 3475, given the recent highs from Tuesday and Yesterday also the LVM created by the move above that level. Below that I adjusted down from the 2975 to the LVM at 2800. I would like to see the test of 34-35 for a move higher, otherwise I think if that fails we revisit 2800.
The second chart shows a relatively current 30 minute. The top line I have snapped I moved up from 3350 to 3475, given the recent highs from Tuesday and Yesterday also the LVM created by the move above that level. Below that I adjusted down from the 2975 to the LVM at 2800. I would like to see the test of 34-35 for a move higher, otherwise I think if that fails we revisit 2800.
Had my EMA crossover theory and tried to get short on the retrace to the 50, obviously didn't work. We'll see if my crossover was a fake out or not.
Emini Day Trading /
Daily Notes /
Forecast /
Economic Events /
Search /
Terms and Conditions /
Disclaimer /
Books /
Online Books /
Site Map /
Contact /
Privacy Policy /
Links /
About /
Day Trading Forum /
Investment Calculators /
Pivot Point Calculator /
Market Profile Generator /
Fibonacci Calculator /
Mailing List /
Advertise Here /
Articles /
Financial Terms /
Brokers /
Software /
Holidays /
Stock Split Calendar /
Mortgage Calculator /
Donate
Copyright © 2004-2023, MyPivots. All rights reserved.
Copyright © 2004-2023, MyPivots. All rights reserved.

