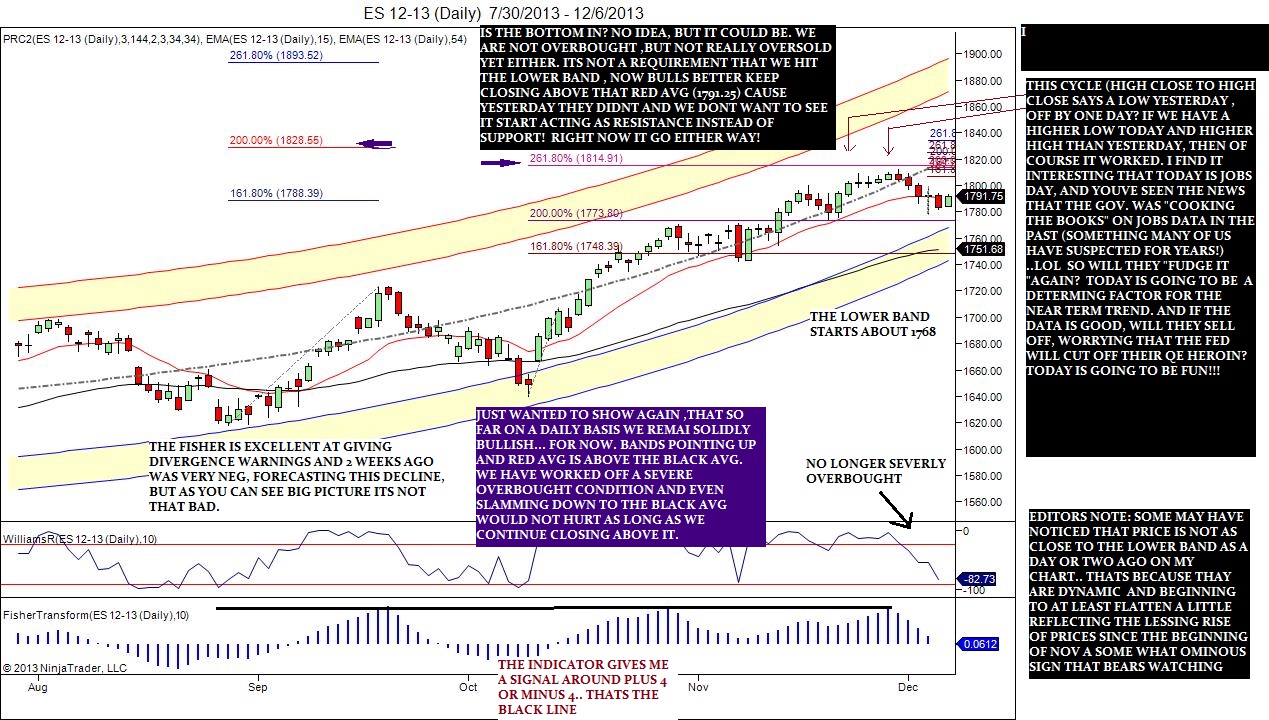
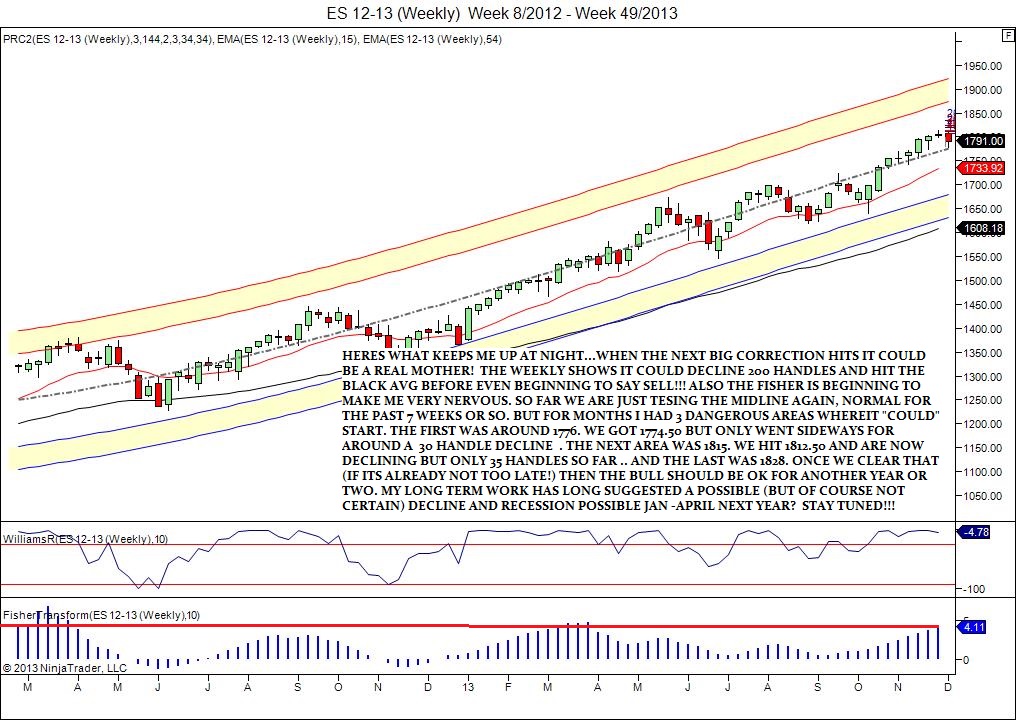
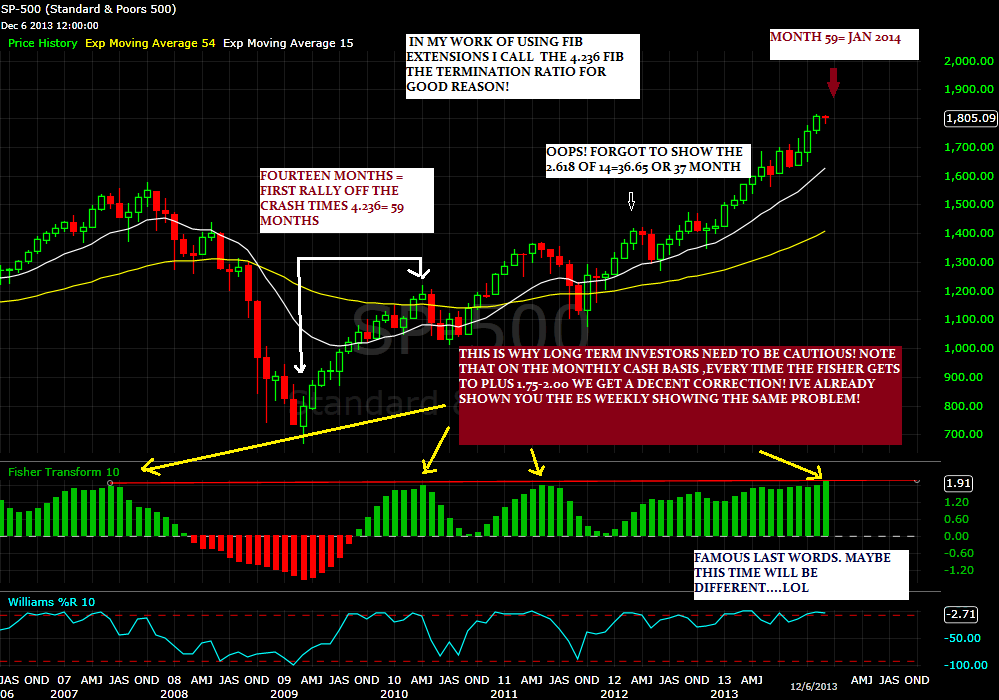
ES End of the week update
ugh! One more thing i forgot to show on the above chart! The all important 2.618 ratio!
(Nanex)–On December 6, 2013, at 8:29:53, which was 7 seconds before the 8:30 AM scheduled release of the Employment numbers and Personal Income, the price of gold as measured by the February 2014 (GC) futures contract plummeted almost $6 on about 600 contracts traded in 50 milliseconds.
At 1.6 seconds before the news release, about 2,000 March 2014 5-Year T-Note Futures contracts sent prices down so fast, that trading halted for 5 seconds: which included the time of the news release (chart 6)! People weren’t able to trade these treasury futures when the news was released. The same thing happened during the Employment numbers release in June.
At 1 second before the news release, the Dow Jones Industrial Average (DJIA) as measured by the ETF symbol DIA, rocketed 170 points higher. The DJIA futures moved the equivalent of 193 dow points at the same time. Both came crashing back seconds later. AND YOU WONDER IF THE DICE ARE LOADED? ROFL
Hey El Koolio,
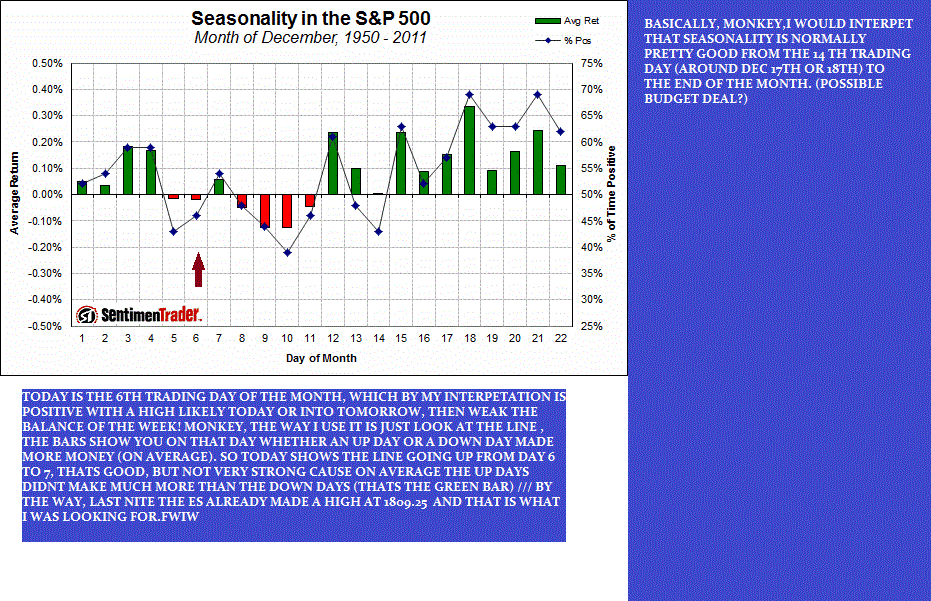
Do you have a seasonal chart you can post showing each day's historical tendency for the coming week? That'd be Kool and useful bro. Good stuff you've laid out here and thanks a bunch for it!
Do you have a seasonal chart you can post showing each day's historical tendency for the coming week? That'd be Kool and useful bro. Good stuff you've laid out here and thanks a bunch for it!
Next week has to be one of the worst weeks of the year during the 1st year of the Presidential Cycle. Since 1965 the OTC had only been up twice (the most recent time in 1985) and the SPX 4 times since 1953.
Report for the week before the 2nd Friday of December.
The number following the year is the position in the Presidential Cycle.
Daily returns from Monday to 2nd Friday.
OTC Presidential Year 1
Year Mon Tue Wed Thur Fri Totals
1965-1 -0.30% 0.14% 1.31% 1.02% 0.80% 2.97%
1969-1 -0.66% -1.02% -0.32% 0.28% 0.60% -1.13%
1973-1 1.32% -1.43% -1.51% -1.86% 0.57% -2.91%
1977-1 0.05% -1.13% -0.12% 0.20% 0.49% -0.50%
1981-1 -0.58% -0.79% 0.08% 0.32% -0.14% -1.12%
1985-1 0.09% 0.13% 0.49% 0.54% 1.06% 2.32%
1989-1 0.26% 0.06% -0.41% -0.08% -0.02% -0.19%
Avg 0.23% -0.63% -0.29% -0.18% 0.39% -0.48%
1993-1 -0.15% -0.23% -0.19% -0.83% -0.10% -1.49%
1997-1 1.08% -1.87% -1.48% -2.39% -1.41% -6.07%
2001-1 -1.44% 0.49% 0.47% -3.23% 0.34% -3.36%
2005-1 -0.69% 0.14% -0.39% -0.25% 0.46% -0.73%
2009-1 -0.22% -0.76% 0.49% 0.33% -0.03% -0.18%
Avg -0.28% -0.45% -0.22% -1.27% -0.15% -2.37%
OTC summary for Presidential Year 1 1965 - 2009
Avg -0.10% -0.52% -0.13% -0.50% 0.22% -1.03%
Win% 42% 42% 42% 50% 58% 17%
OTC summary for all years 1963 - 2012
Avg 0.17% 0.05% 0.02% -0.39% 0.26% 0.10%
Win% 62% 50% 53% 46% 56% 52%
SPX Presidential Year 1
Year Mon Tue Wed Thur Fri Totals
1953-1 -0.12% -0.32% -0.12% -0.24% -0.08% -0.88%
1957-1 -0.94% -0.88% -0.12% 0.10% 0.44% -1.40%
1961-1 0.32% -0.11% 0.08% -0.40% 0.47% 0.36%
1965-1 -0.75% 0.88% -0.12% 0.31% 0.26% 0.59%
1969-1 -1.20% -0.09% -0.08% 0.04% 0.32% -1.00%
Avg -0.54% -0.10% -0.07% -0.04% 0.28% -0.47%
1973-1 1.49% -1.95% -2.57% -1.27% 0.99% -3.32%
1977-1 -0.42% -1.53% -0.05% 0.19% 0.74% -1.07%
1981-1 -0.85% -0.30% 0.53% 0.18% -0.62% -1.05%
1985-1 0.62% 0.07% 0.94% 0.20% 1.55% 3.38%
1989-1 0.22% -0.52% -0.29% -0.28% 0.32% -0.55%
Avg 0.21% -0.85% -0.29% -0.19% 0.60% -0.52%
1993-1 0.33% 0.07% -0.10% -0.45% -0.05% -0.21%
1997-1 -0.14% -0.67% -0.61% -1.53% -0.16% -3.12%
2001-1 -1.59% -0.28% 0.03% -1.56% 0.33% -3.06%
2005-1 -0.24% 0.13% -0.50% -0.12% 0.28% -0.45%
2009-1 -0.25% -1.03% 0.37% 0.58% 0.37% 0.05%
Avg -0.38% -0.35% -0.16% -0.62% 0.15% -1.36%
SPX summary for Presidential Year 1 1953 - 2009
Avg -0.23% -0.43% -0.18% -0.28% 0.34% -0.78%
Win% 33% 27% 33% 47% 73% 27%
SPX summary for all years 1953 - 2012
Avg 0.19% 0.01% 0.04% -0.31% 0.22% 0.15%
Win% 58% 47% 54% 40% 67% 55%
Money Supply (M2)
The money supply chart was provided by Gordon Harms. Money supply growth continued to decline last week.
SPX versus M2 Money Supply Charts
Conclusion
The threat of tapering along with seasonal weakness is likely to take its toll on the market next week.
Just a wild guess: A little havoc in the financial markets will spook the Fed and they will promise to continue QE for the foreseeable future.
I expect the major averages to be lower on Friday December 13 than they were on Friday December 6.
Last week the OTC was up a little while the other indices were down a little so I am calling last weeks positive forecast a tie.
This report is free to anyone who wants it, so please tell your friends. They can sign up at: http://www.alphaim.net/signup.html. If it is not for you, reply with REMOVE in the subject line.
Gordon Harms produces a Power Point for our local timing group meetings. You can get a copy of that at: http://stockmarket-ta.com/. I have been having some trouble accessing the web site and hope to have that ready later in the day.
Good Luck,
YTD W 22/L 14/T 13
Author: Mike Burk
Mike Burk
Mike Burk is an employee and principal of Alpha Investment Management (Alpha) a registered investment advisor. Charts and figures presented herein are believed to be reliable but we cannot attest to their accuracy. Recent (last 10-15 yrs.) data has been supplied by CSI (csidata.com), FastTrack (fasttrack.net), Quotes Plus (qp2.com) and the Wall Street Journal (wsj.com). Historical data is from Barron's and ISI price books. The views expressed are provided for information purposes only and should not be construed in any way as investment advice. Furthermore, the opinions expressed may change without notice.
Copyright © 2003-2013 Mike Burk
All Images, XHTML Renderings, and Source Code Copyright © Safehaven.com
SEARCH
TRUE MONEY SUPPLY
Source: The Contrarian Take http://blogs.forbes.com/michaelpollaro/
austrian-money-supply/
COURTESY of Mike Burk from safehaven .com
Monkey ,above is a more specific analysis using just the presidential cycle tendencies also... without going thru a long explaination , basically, historically speaking ,this week sucks at this juncture of the presidential cycle . lol
And finally, again from mike burk at safehaven. com...December
Since 1963, over all years, the OTC in December has been up 62% of the time with an average gain of 2.0%. During the 1st year of the Presidential Cycle December has been up 50% time with an average gain of 0.7% The best December ever for the OTC was 1999 (+22.0%), the worst 2002 (-9.7%).
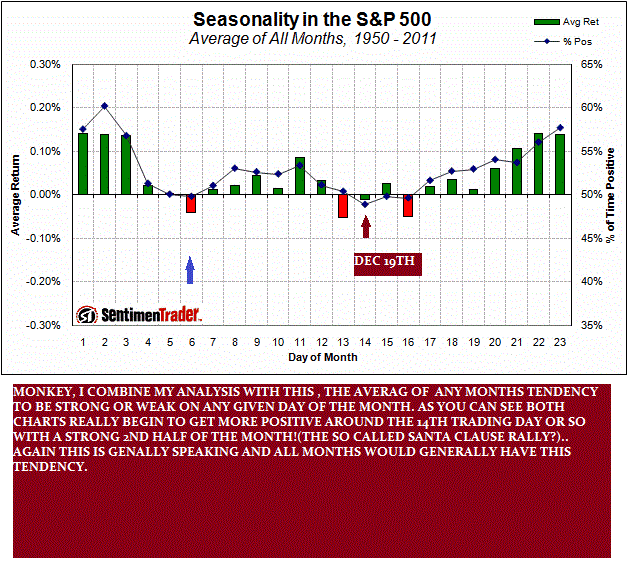
The average month has 21 trading days. The chart below has been calculated by averaging the daily percentage change of the OTC for each of the 1st 11 trading days and each of the last 10. In months when there were more than 21 trading days some of the days in the middle were not counted. In months when there were less than 21 trading days some of the days in the middle of the month were counted twice. Dashed vertical lines have been drawn after the 1st trading day and at 5 trading day intervals after that. The line is solid on the 11th trading day, the dividing point.
In the chart below the blue line shows the average of the OTC in December over all years since 1963 while the green line shows the average during the 1st year of the Presidential Cycle
If the middle line is the 11th trading day of the month, then you can see also a tendency for strength after the 14th trading day or so... hope this helps!
And by the way, monkey, if you look at my weekly es update of Dec 2, 2013 you will see where i already posted it!!
Emini Day Trading /
Daily Notes /
Forecast /
Economic Events /
Search /
Terms and Conditions /
Disclaimer /
Books /
Online Books /
Site Map /
Contact /
Privacy Policy /
Links /
About /
Day Trading Forum /
Investment Calculators /
Pivot Point Calculator /
Market Profile Generator /
Fibonacci Calculator /
Mailing List /
Advertise Here /
Articles /
Financial Terms /
Brokers /
Software /
Holidays /
Stock Split Calendar /
Mortgage Calculator /
Donate
Copyright © 2004-2023, MyPivots. All rights reserved.
Copyright © 2004-2023, MyPivots. All rights reserved.
