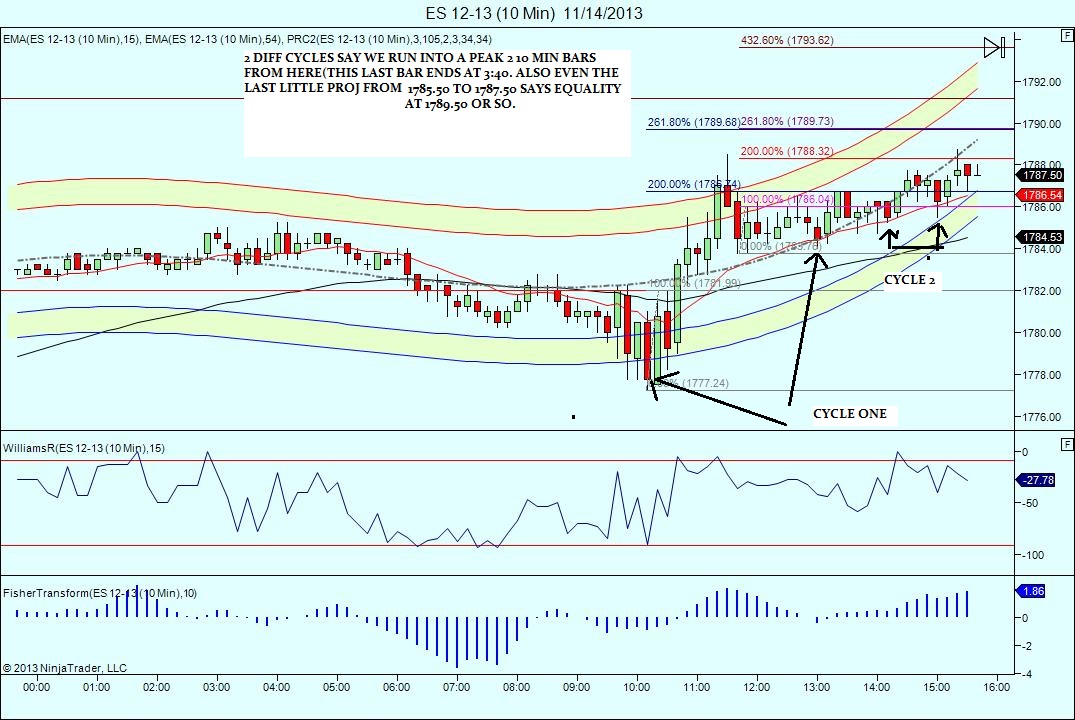
ES Thurs 11-14-13
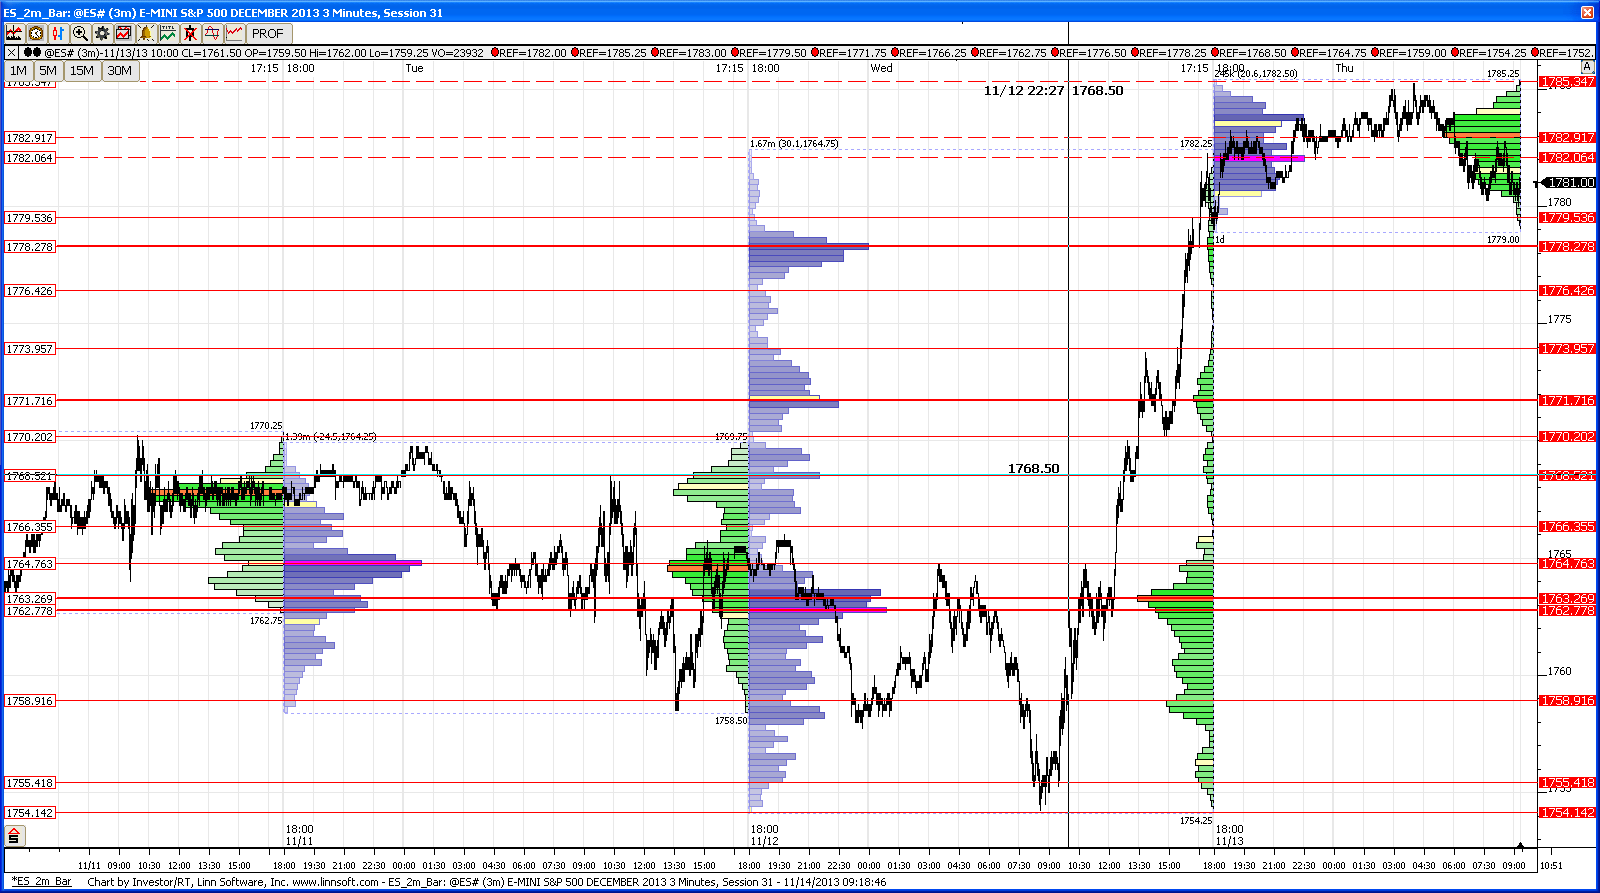
Here's what i have...only one chart with all session data (dotted lines are based on o/n action)...
pretty clear curves and zones to work from below
i have daily and weekly pivots in the 87-89 areaa and then up at 95 and 99-00...but remember there is no hard resist above current highs
good luck
pretty clear curves and zones to work from below
i have daily and weekly pivots in the 87-89 areaa and then up at 95 and 99-00...but remember there is no hard resist above current highs
good luck
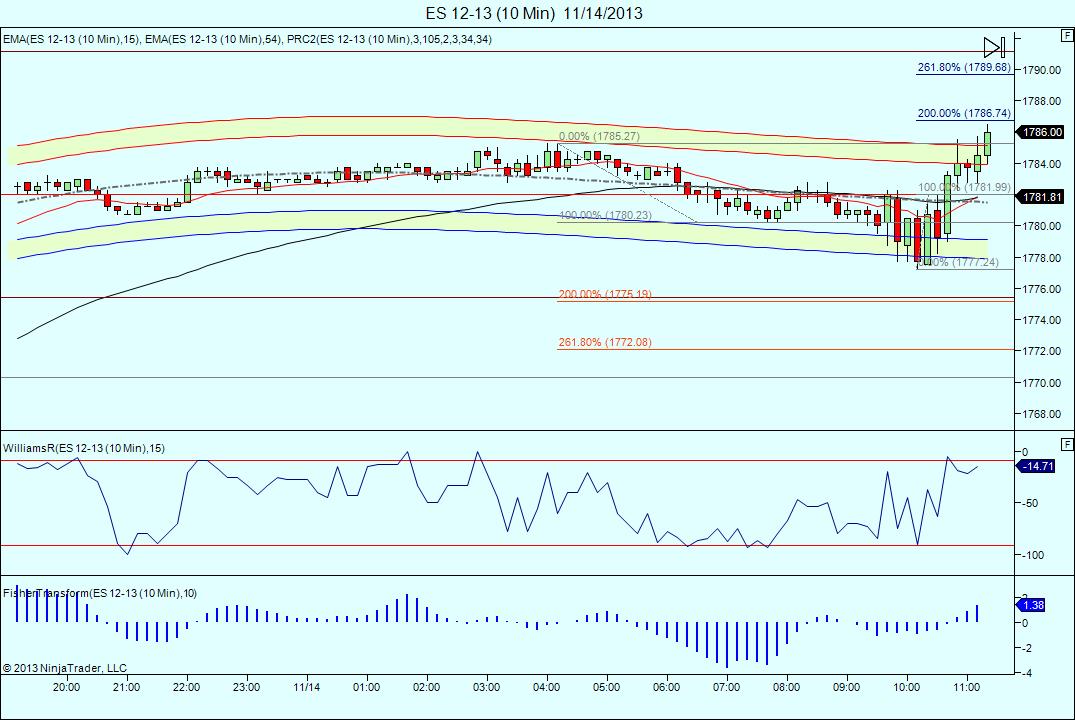
10 min, 5 min and below are now positive.. took a quick long a few min ago from 1783.25 to 1785.25 expecting 86.75 and higher later.
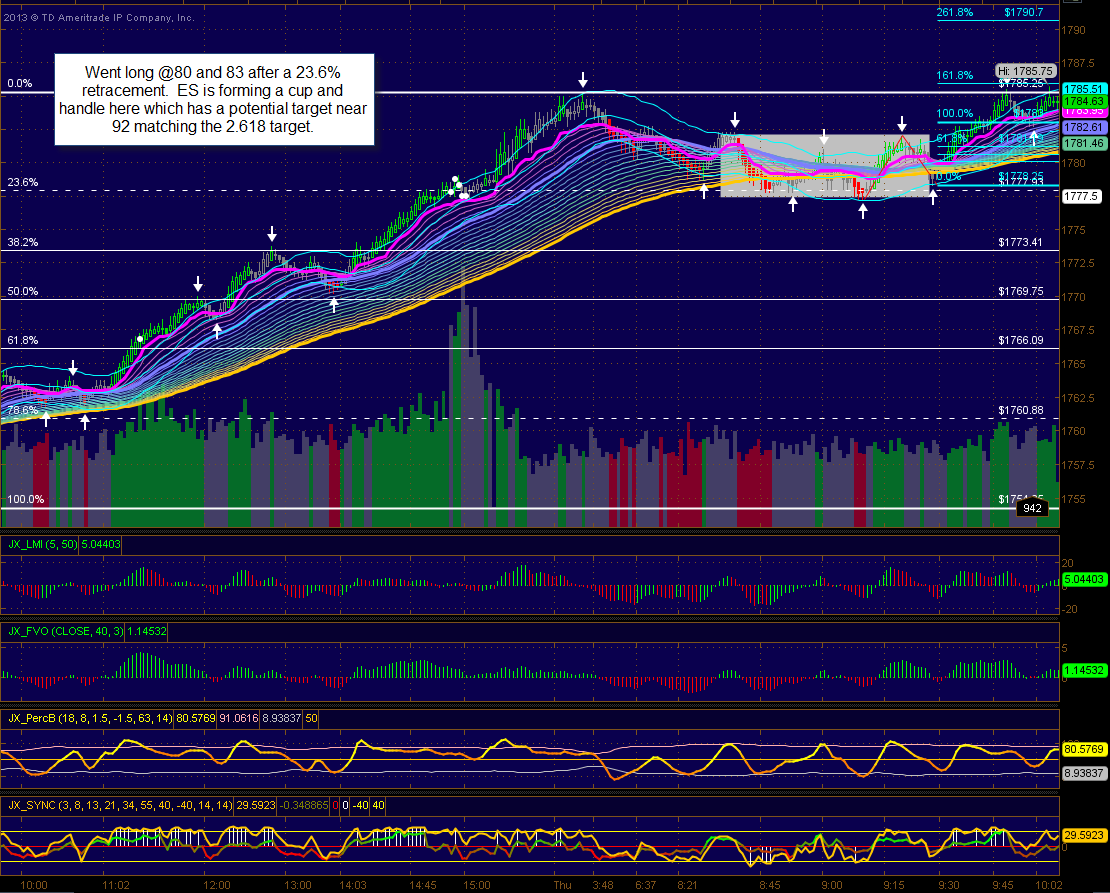
great chart!.. im mindful of the fact that a 20 handle day(which is 2 less than yesterday could portend a move to around 98!...
yesterday's 1788 target met~
if an assault on 98- 1800 is in the cards you would expect the market to creep higher never delining more than about 3 handles(like yesterday)
so the 82-83 area served initially for a short down to 78-79 area where a long could have been tried aiming for o/n high...once there u could have tried another short aiming down to the 82-83 area and depending on your bullishness that was an area to use as launching point to new all time highs....and we even stopped at the 87-89 pivot area i mentioned for a nice reversal back fdown to the o/n high as i speak
the first two trades were decent odds, especially the second one (in case u did not want to short early in the morning)...the short from the o/n high was tricky since we were above the peak of the o/n bell curve and that is by the definition a lower odds short...the short from the 87-89 was also hard but it also had some confluence with the ab=cd measured move from 36.5 to 70.25 & 54.25 to 88
in any case, hope the day is going fine
Originally posted by NickP
Here's what i have...only one chart with all session data (dotted lines are based on o/n action)...
pretty clear curves and zones to work from below
i have daily and weekly pivots in the 87-89 areaa and then up at 95 and 99-00...but remember there is no hard resist above current highs
good luck
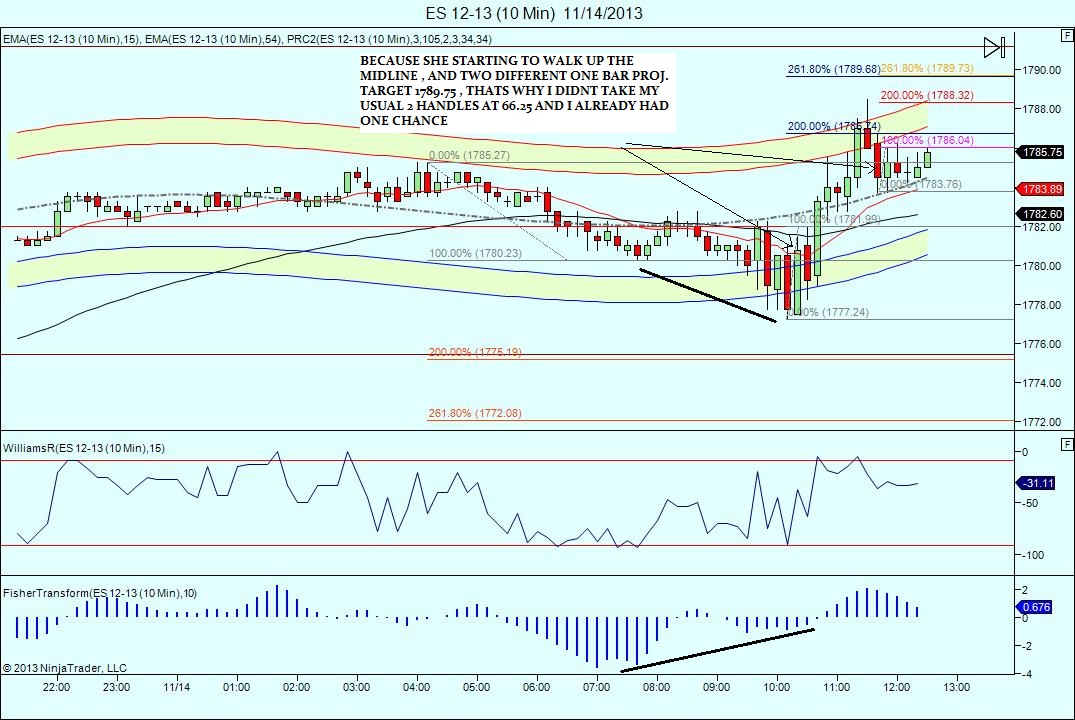
im currently working a small long from 84.25, im going to grab some eats.. targeting 89-90 zone ,but will probably exit just in front ... i hope! i dont want to see this go below 83, and my stop is currently 82
well, that makes 3 chances to grab a 2 handle trade and didnt...hope im doing the right thing!
Emini Day Trading /
Daily Notes /
Forecast /
Economic Events /
Search /
Terms and Conditions /
Disclaimer /
Books /
Online Books /
Site Map /
Contact /
Privacy Policy /
Links /
About /
Day Trading Forum /
Investment Calculators /
Pivot Point Calculator /
Market Profile Generator /
Fibonacci Calculator /
Mailing List /
Advertise Here /
Articles /
Financial Terms /
Brokers /
Software /
Holidays /
Stock Split Calendar /
Mortgage Calculator /
Donate
Copyright © 2004-2023, MyPivots. All rights reserved.
Copyright © 2004-2023, MyPivots. All rights reserved.
