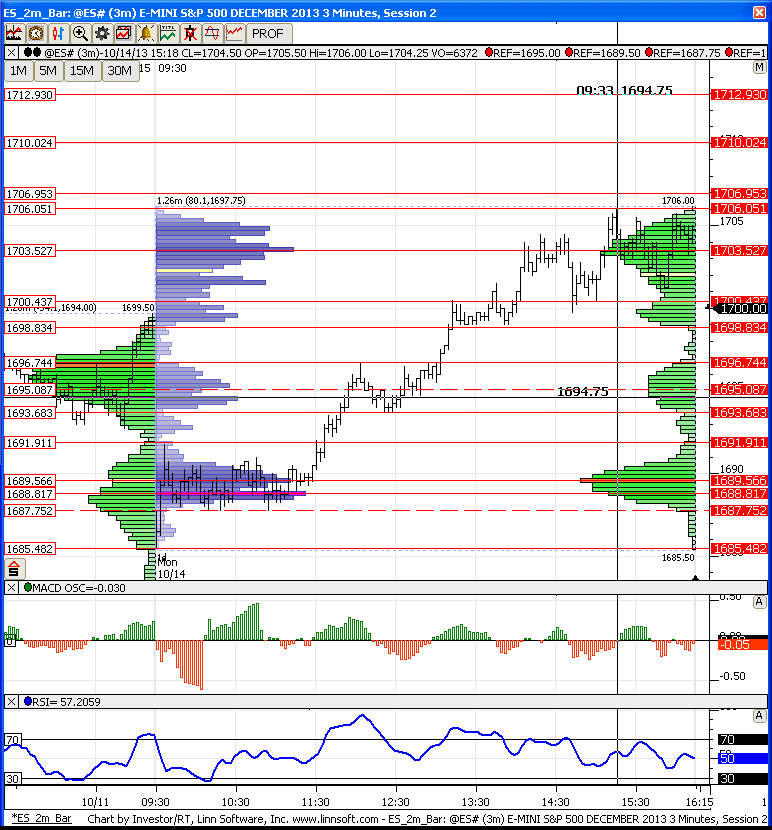
ES Tuesday 10-15-13
1704.50 is magnet price for me today
1699 - 1700.50 first zone
then 96.50
key LVN at 92- 93.50
above is 1707.50 and 1710
1699 - 1700.50 first zone
then 96.50
key LVN at 92- 93.50
above is 1707.50 and 1710
nice projection zone Kool...!
Thanks,pal... The only thing i would add to yours and Nicks excellant commentary is that im more interested in buys as i have been for 3 days now..Especially in a news driven market like this...
By the way the shortest term projection here is currently 1700.50(at least)
Bingo...now, if we continue lower, i would suspect that 1692 may come into play. if we rally 1707,1711 and 1714-16 might be seen....
I was gonna try to sell my 07.50 number and it looks like somebody front ran me by one point....rats !!
Now it will be interesting to see if they can hold 1701.00-1701.50....?
As I am done for the day and just reading, I came across this. Demark is a noted technician
http://www.businessinsider.com/tom-demark-fears-1929-style-market-crash-2013-10
http://www.businessinsider.com/tom-demark-fears-1929-style-market-crash-2013-10
I'm looking for someone with tic data to verify a zone I'm babbling about on this video......and I fess up to a mistake I made which cost me an opportunity today
I followed Demark for years and all I can say is I would be very skeptical of his market calls.......I've seen him get lots of them wrong....all most as many as I have for long term stuff....LOL....I use to have his sequential and all that stuff back in my days of Supercharts before they turned into Tradestation
I'm not beating him up but i wouldn't follow any of it unless it was confirmed by your own work......but still a hearty thanks for putting this out there.....always interesting to read where the "gurus" are at
I'm not beating him up but i wouldn't follow any of it unless it was confirmed by your own work......but still a hearty thanks for putting this out there.....always interesting to read where the "gurus" are at
Originally posted by rburns
As I am done for the day and just reading, I came across this. Demark is a noted technician
http://www.businessinsider.com/tom-demark-fears-1929-style-market-crash-2013-10
what just happened is another example of what bruce mentioned in his video abt bell curves
in the chart i posted earlier today, u can see the top edge of the bottom curve was 92 (the bottom of that lvn area 92-93.5 taht bruce mentioned earlier today)....we pierced thru it and bounce but came back to test the middle of that bell curve (which i have highlighted with the 88.5 and 89.5 lines) which also happens to be the vpoc and poc from yest....and from that area we got the stronger bounce that has taken us back inside the middle curve from yest
cool stuff
Originally posted by NickP
this is what i have for today...pretty much in line with bruce's.....the dashed lines are there but i am not giving them too much importance as they come pretty close to other lines
bruce, i have 706.25 as poc for 9/20, so it closed today on that touch of 706.5...i had 706-707 as a zone as shown on that chart i posted early this morning, to account for yest rth high, that poc and a little edge from 9/20 at 07
hope it helps
hope it helps
Originally posted by BruceM
I'm looking for someone with tic data to verify a zone I'm babbling about on this video......and I fess up to a mistake I made which cost me an opportunity today
Emini Day Trading /
Daily Notes /
Forecast /
Economic Events /
Search /
Terms and Conditions /
Disclaimer /
Books /
Online Books /
Site Map /
Contact /
Privacy Policy /
Links /
About /
Day Trading Forum /
Investment Calculators /
Pivot Point Calculator /
Market Profile Generator /
Fibonacci Calculator /
Mailing List /
Advertise Here /
Articles /
Financial Terms /
Brokers /
Software /
Holidays /
Stock Split Calendar /
Mortgage Calculator /
Donate
Copyright © 2004-2023, MyPivots. All rights reserved.
Copyright © 2004-2023, MyPivots. All rights reserved.
