ES Thursday 9-19-13
This is from the other day and I missed the question :
Daddywolf....I don't know where the specific thread is that Joe and I did......it was too long ago....I prefer to use previous days volume clusters to help identify the areas......most times the overnight nodes will go well with a RTH key spot on the charts but sometimes in the Overnight 8:30 news reports can form nodes so it's good to know them and anyplace big volume had happened but confirm with the day session
It is much harder to trade these as they develop during the day but in general you never really want to see price get 1.75 points above or below a node...for example...if you see a selling node that drives the market down then you don't want price to get 1.75 points above that node on a return to it ....that implies that the sellers may have left the area...it isn't perfect and it doesn't mean that we will keep rallying but to me it usually means that the sellers who originally sold are not there anymore..
the most important prices for me now
1723 - 1725
1716 -1717
1710- 1712.25
1706.50
1702-1704 ***** the big kahuna
lets see what the On session confirms for us
hope I didn't miss any questions the past day or so
hey Duck ..I remember Eddiie Cuervo ( he wrote the Gen -x courses) and have both his manuals..can't remember which forum but he was a good guy...left trading to go do real estate I think in Florida....a long time ago that was...
when you do a reply you click on "FILE Upload"...below all those smiley things....then " Choose file " and then upload.
Originally posted by NickP
and then u simply paste the picture into the body of the commentary window and that's it ?
Originally posted by BruceM
Nick...u asked about screen captures....IN MD you select FILE >>>> SAVE >>>>>SAVE PICTURE
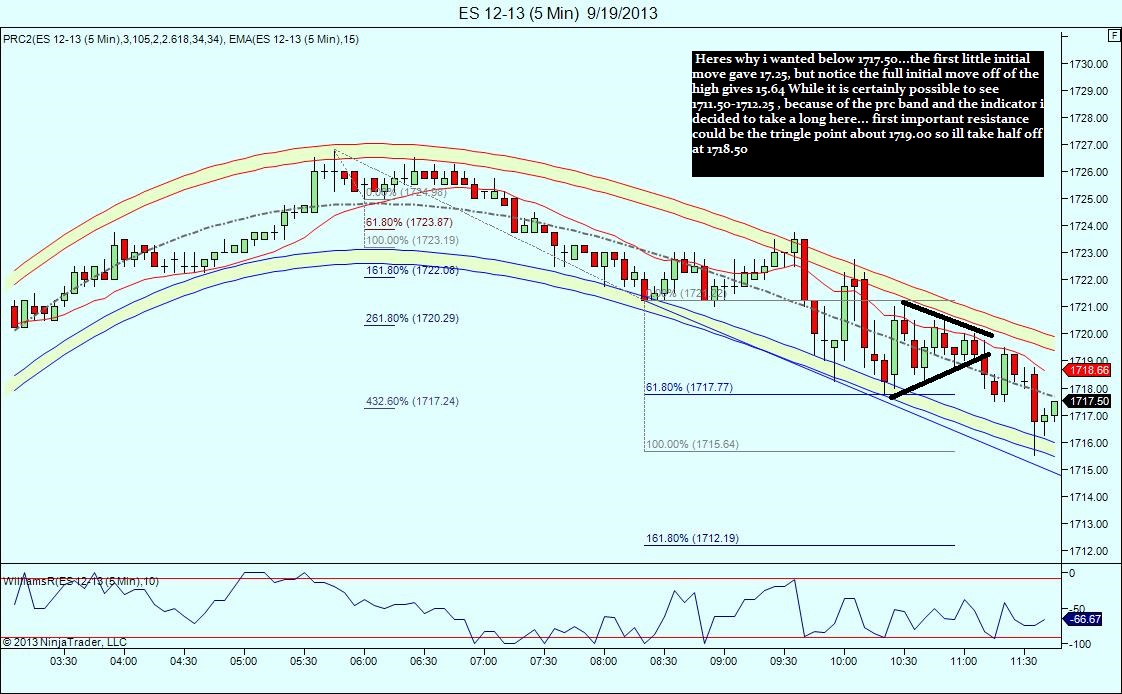
FINALLY BROKE BELOW 1717.50... BUYING HERE
Long here from 16.00. Hope this works out...
under that 16.50 is my buy point but I'm gonna let this one go.....burned out from life.....what I need is a good "session" on my riding mower to relax
go man go...good luck koolio....like that spot..
Originally posted by BruceM... Try a cold beer , friend....if this trade doesnt work out..ill join u.
under that 16.50 is my buy point but I'm gonna let this one go.....burned out from life.....what I need is a good "session" on my riding mower to relax
..The 5 min ema avg is also here
2 off at 1718.50 for the reson i outlined...2.5 handles so far stop on the last two is raised to 1716.00, breakeven...
nice trades kool and bruce ! wtg
got stopped at 1716.00 break even on the last two....sigh!.....
Originally posted by BruceM
daddywolf or whoever likes the volume stuff....why I think the O/N low is gonna be broken
Bruce, liking those volume videos(charts), thanks. Gotta figure out how to work them up on my system
Emini Day Trading /
Daily Notes /
Forecast /
Economic Events /
Search /
Terms and Conditions /
Disclaimer /
Books /
Online Books /
Site Map /
Contact /
Privacy Policy /
Links /
About /
Day Trading Forum /
Investment Calculators /
Pivot Point Calculator /
Market Profile Generator /
Fibonacci Calculator /
Mailing List /
Advertise Here /
Articles /
Financial Terms /
Brokers /
Software /
Holidays /
Stock Split Calendar /
Mortgage Calculator /
Donate
Copyright © 2004-2023, MyPivots. All rights reserved.
Copyright © 2004-2023, MyPivots. All rights reserved.
