ES 5-3-13
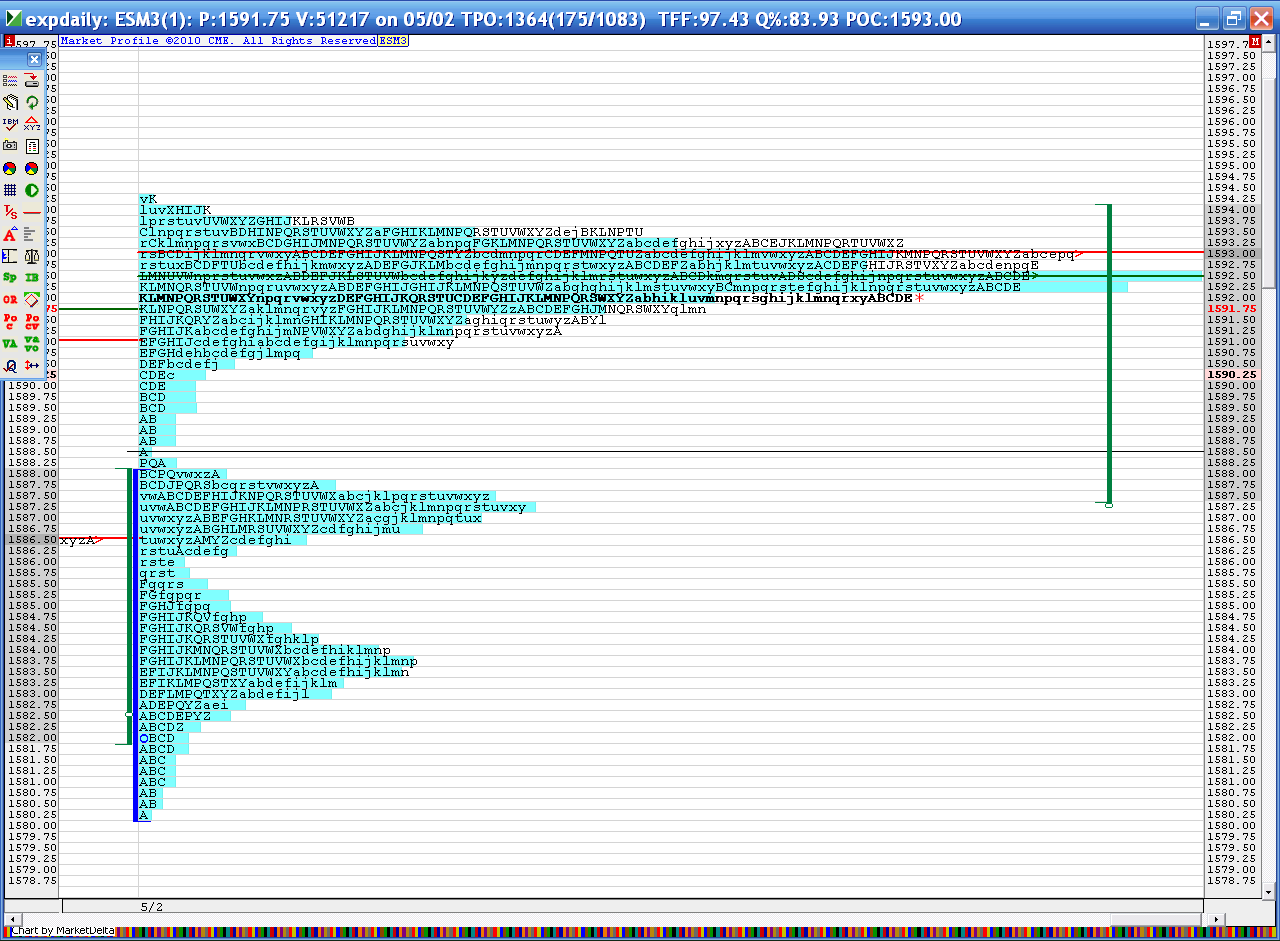
The super secret chart from yesterdays day session.
87 - 88 and the 92.50 are the biggest numbers to watch. Report at 8:30 may change all this.
There is also a low volume area and single print at 85.75...so if we open in Value and drop down we have two key buy points. Or just snap a line at 86 - 88 and use that as a zone
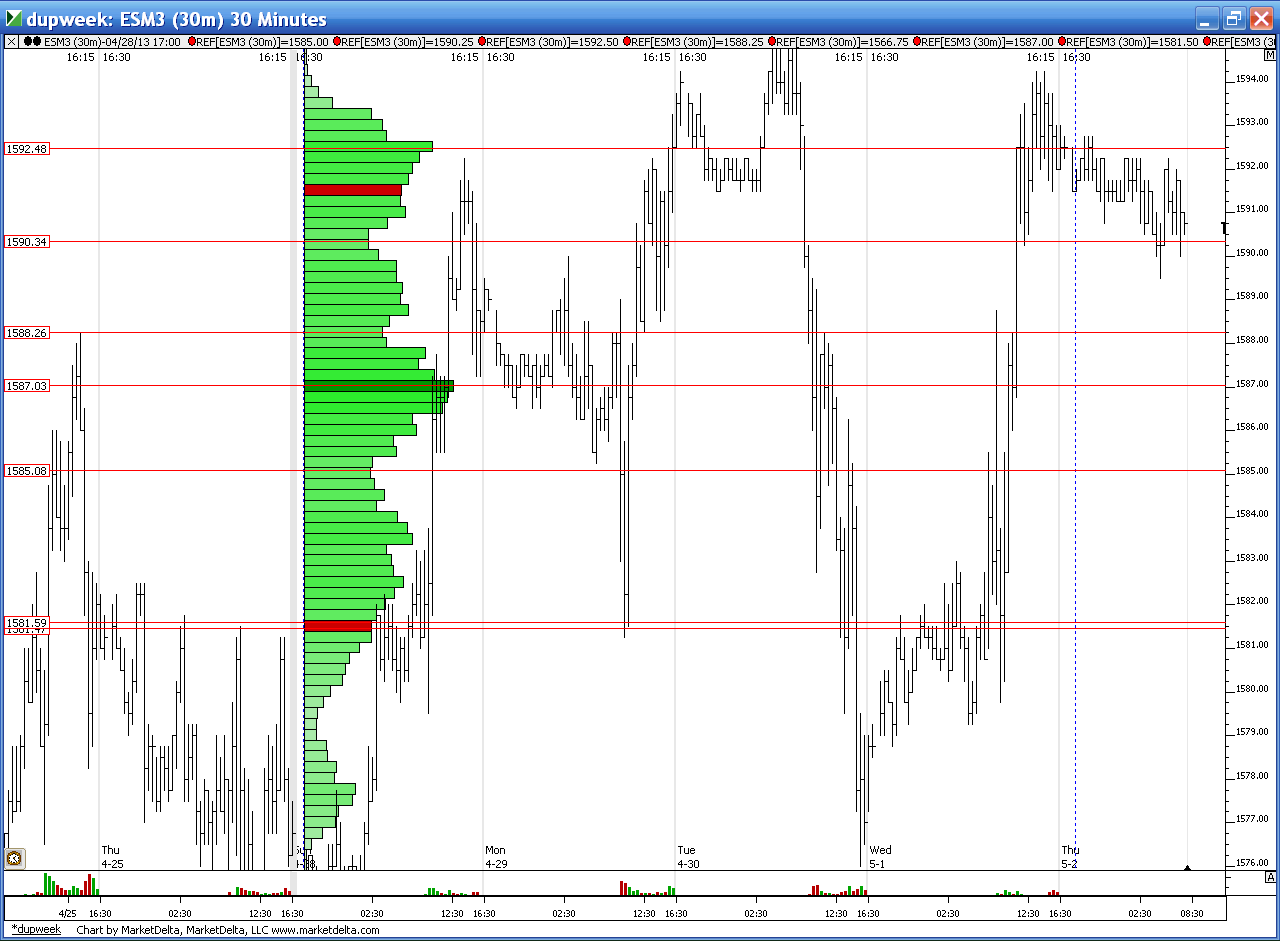
here is how the weekly looks so far..note the low / high volume combination at 87 - 88.25 this week..
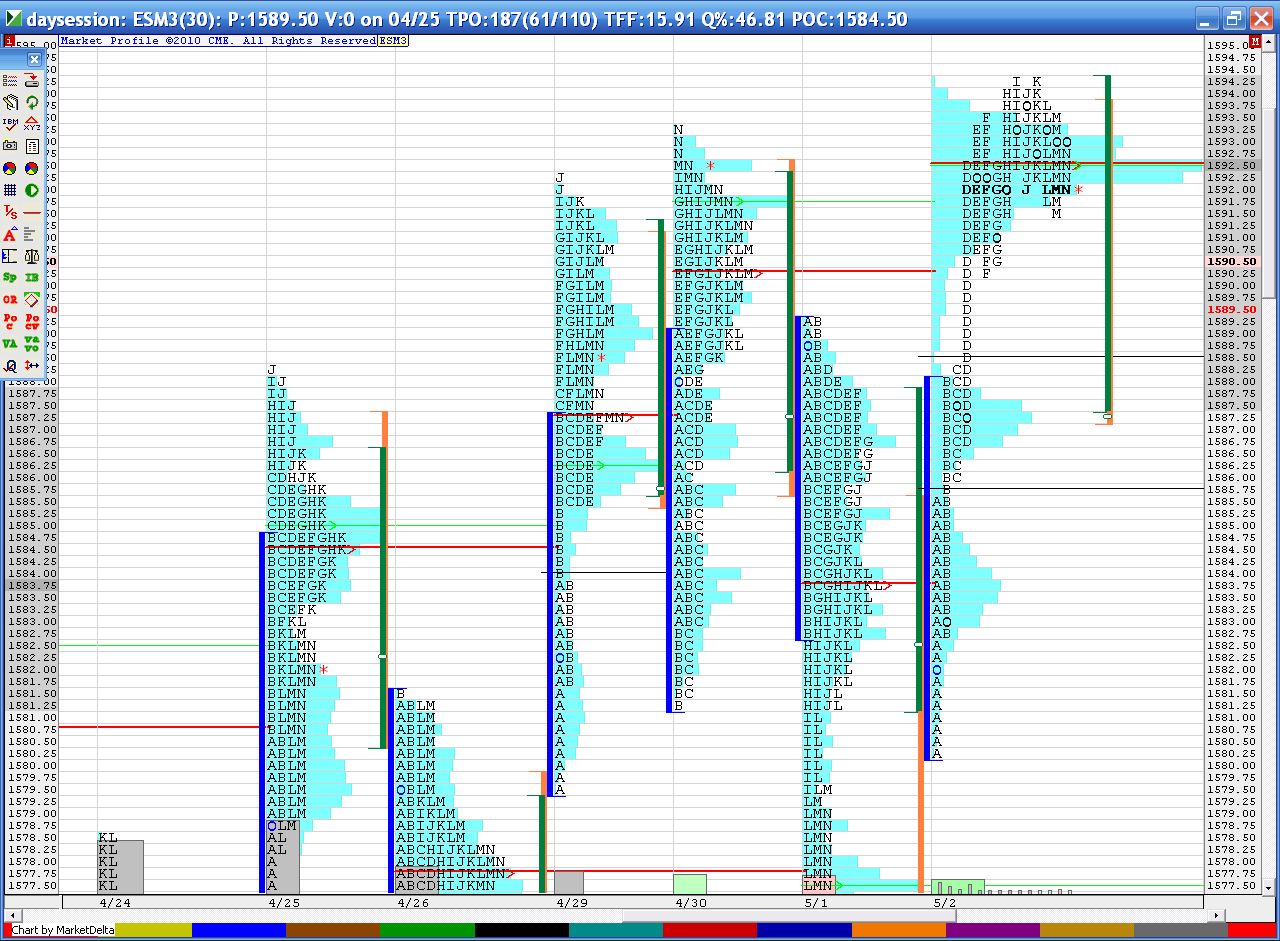
and here is traditional MP chart
My plan was buying the 88-89 support from yesterday if we could get to it. If not, the buying 94 once we got past the 93 bracket top, but i guess there were alot of buy stops in place for that number today.
Not gonna lie, didnt really anticipate it to move this quickly. My plan got left behind. New highs are annoying, no reference points until we find some type of a top.
Not gonna lie, didnt really anticipate it to move this quickly. My plan got left behind. New highs are annoying, no reference points until we find some type of a top.
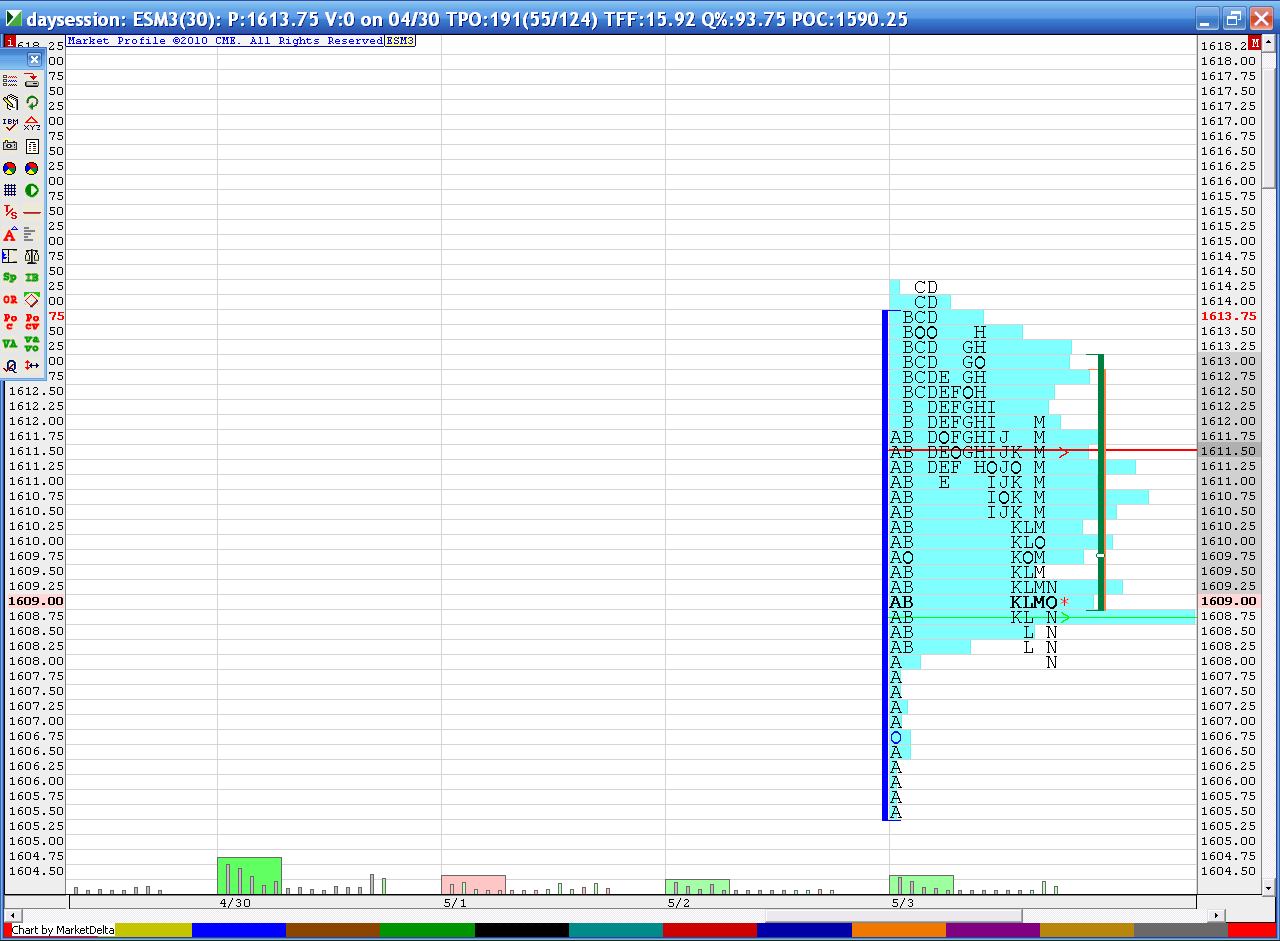
air pocket sits under the 08.50 for those who are trying to sell up here
I don't have a lot of time due to other commitments, but I had to point out that a 50% extension of last week's range is 1611.00, often a stumbling block area.
cool stuff Paul...I just covered all but one at the 08.50 test..trying to hold last one for 06.75 and if I had more working I'd try to get to the 03.75 - 04.....either way it won't be an easy drop if it even comes
this is the 50% mark too !!
this is the 50% mark too !!
interesting how a key stock like Apple has not been able to hold above it's opening price for too long today..
1506 - 1508.50 is the zone I am watching closely regardless of if that zone trades today or monday..In the back of my mind I am still thinking about the 1592.50 retest....It will be interesting to see how long it takes to get back there..
I've been furthering my education and am reviewing this course here
http://www.l2st.co.uk/
I've only made it to about 4 hours of the 30 hours of the course. This guy Kam is really sharp and articulates very well. Much better than I ever could. I will do a formal review at a later date real soon when life is normal again. This is right up my alley as he is a big fan of market profile, volume profile, vwap and discipline . Just thought I'd pass that along if some are looking for advanced education. I am not part of his trade room so my exposure is only to the recorded/printed material so far.
Hope all have a great weekend.
here is a shot of why that area is important to me..today the big volume came in the Overnight session so here is my Volume profile all session chart...note the red line and VA low based on Volume in the 06 - 08.50 area...we are poking in there now..almost !!
Thx Bruce, always looking for educational info. I'll check it out. Hope the family is doing better
Thanks Bkay...2 out of 3 kids are better today..the 11 year old is getting the fever down...
Not sure why..perhaps it's Apple but I have a feeling that we are not gonna have a good strong close towards the high today...I think the afternoon session are cruel in general so I'm shutting down and gonna get some more fresh air.
A good day today for me but just an OK week. I'm hoping to be more in tune next week.
Interesting how that low volume area goes well with the buying tail as per classic MP charts
Just curious of everyone's thoughts, but in my mind the chart from Friday looks promising to set up an island pattern. We have a huge runup with high volume and rounds out on the top. If Sunday opens with a gap down I think we have a good chance of hitting 92.5 as early as mon, Tuesday at the latest. Bull and bear swings typically end with a sign of "excess" such as this. This week should be interesting.
I like your thinking. A lower opening Monday, especially one that leaves the daily high lower than about 50% of the gap (1599.75) would probably mark THE TOP for quite a while. Most likely wishful thinking.
I like the concepts you and Thomas are talking about. The only thing that concerns me is that we have a poor high from Friday - Look at that double top in "C" and "D" periods...that doesn't show aggressive sellers. The other concern is that the Monthly R1 level comes in exactly at 1614.25 and look where Fridays high is.
Hopefully the overnight session will give us some clues.
Here is a quick look at that double top
Hopefully the overnight session will give us some clues.
Here is a quick look at that double top
Originally posted by aumadvisor
Just curious of everyone's thoughts, but in my mind the chart from Friday looks promising to set up an island pattern. We have a huge runup with high volume and rounds out on the top. If Sunday opens with a gap down I think we have a good chance of hitting 92.5 as early as mon, Tuesday at the latest. Bull and bear swings typically end with a sign of "excess" such as this. This week should be interesting.
Emini Day Trading /
Daily Notes /
Forecast /
Economic Events /
Search /
Terms and Conditions /
Disclaimer /
Books /
Online Books /
Site Map /
Contact /
Privacy Policy /
Links /
About /
Day Trading Forum /
Investment Calculators /
Pivot Point Calculator /
Market Profile Generator /
Fibonacci Calculator /
Mailing List /
Advertise Here /
Articles /
Financial Terms /
Brokers /
Software /
Holidays /
Stock Split Calendar /
Mortgage Calculator /
Donate
Copyright © 2004-2023, MyPivots. All rights reserved.
Copyright © 2004-2023, MyPivots. All rights reserved.


