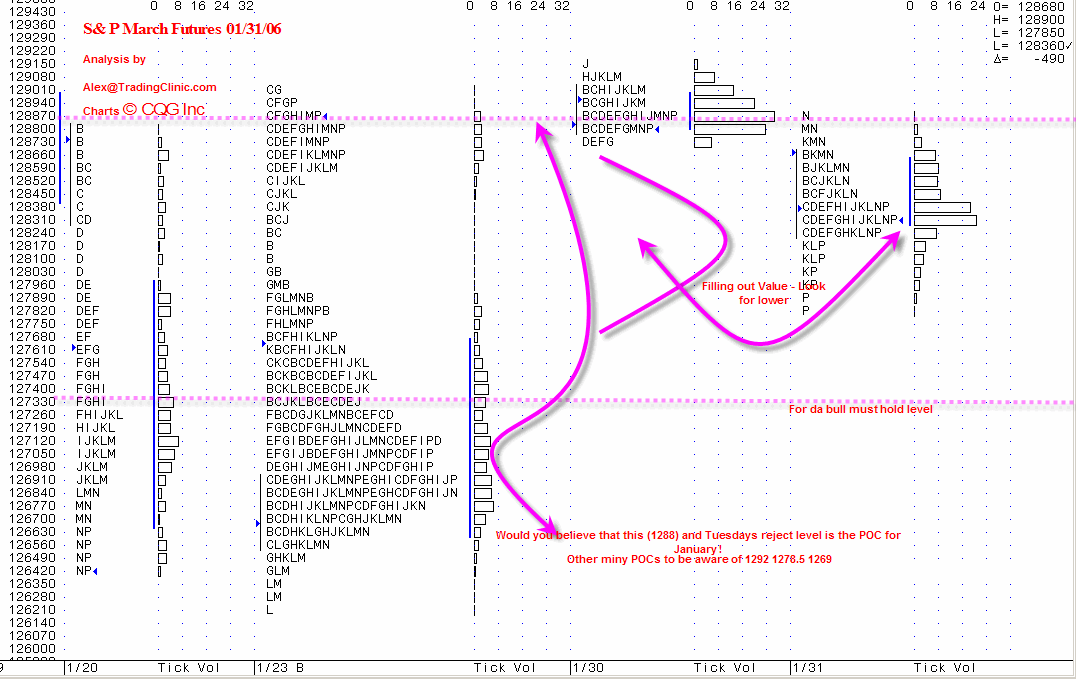
MP Spoos Jan 31st
I notice at the bottom of the CQG charts it says Tick Vol. Does this mean that ticks are being used as a proxy for volume in the charts? Or is it actual volume in contracts being shown here?
Don Jones on several occassions has run correlations and found that Tic Vol = Actual Vol approx 97% . That is gooe enough for me and when I have run same correlations I have found pretty much same % . Now not all prices are the same and not all volume is the same. The trick is knowing when to differentiate just as the trick is knowing when to differentiate your style of trading as well as quantity depending on the type of day unfolding
I ran correlations in the CME E-minis and found that the correlations were 95% so also good enough for me. Ticks are useful in markets that don't have volume as the proxy is assumed good enough. Proxy is good if you have the same distribution of large and small players. If there is a strong bias or absence of one then the correlation won't be as good. (i.e. total volume traded by small traders should offset large traders... for every 500 one contract trader there should be 1 five hundred contract trader etc...)
well in the German Bund market which can trade 1.5 million per day the correlation is still good at 97% and there are plenty of trades of 2000 or 3000 at a clip so don t think imho that what you are trying to suggest makes much differnece. Sorry I am not trying to criticise , I'm sure it sounds like it but even if the correlation were to drop to say 82% would it really make that much difference is what I'm really saying.
Unless you were trading to the tick then you are right - no it wouldn't.
Emini Day Trading /
Daily Notes /
Forecast /
Economic Events /
Search /
Terms and Conditions /
Disclaimer /
Books /
Online Books /
Site Map /
Contact /
Privacy Policy /
Links /
About /
Day Trading Forum /
Investment Calculators /
Pivot Point Calculator /
Market Profile Generator /
Fibonacci Calculator /
Mailing List /
Advertise Here /
Articles /
Financial Terms /
Brokers /
Software /
Holidays /
Stock Split Calendar /
Mortgage Calculator /
Donate
Copyright © 2004-2023, MyPivots. All rights reserved.
Copyright © 2004-2023, MyPivots. All rights reserved.
